
How Traffic Health Watches Your Domains
Your tracking domains are the backbone of every campaign you run. If a domain goes down, or if it gets flagged by a reputation source, your partners' links can stop working and your conversions can quietly disappear. Traffic Health watches for both kinds of trouble around the clock, so you find out before your partners do.
There are two separate monitoring streams, and Traffic Health gives each one its own dedicated tab. The Uptime Incidents tab tracks whether your domains are technically reachable and serving traffic. The Reputation Flags tab tracks whether your domains or their IP addresses have been flagged by named reputation and threat-intelligence sources. This article walks through both, plus the 90-day uptime timeline that visualizes a domain's recent history.
The two streams run on different cadences. Uptime is monitored in near real time. Traffic Health continuously checks that each domain responds, so a new incident appears within minutes of a domain going down. Reputation is checked on a daily basis against external sources, because those sources themselves refresh their lists on a daily rhythm. Knowing the cadence helps you set expectations: a domain that just went down shows up almost immediately, while a brand-new reputation flag may take up to a day to surface.
To get notified outside the platform when something changes, set up channels in the External Notifications area. That configuration lives in its own article, linked at the end of this one.
Incidents, Flags & Tasks: What's the Difference
Three words come up constantly in Traffic Health, and they mean different things. Getting them straight makes everything else easier to read.
In short, incidents and flags describe what's wrong, and tasks describe what to do about it. Uptime incidents and reputation flags each get a dedicated tab, covered next.
The Uptime Incidents Tab
Open
Reading the Uptime Summary
The band across the top rolls up the health of all your domains at a glance, so you can triage before digging into any single incident.
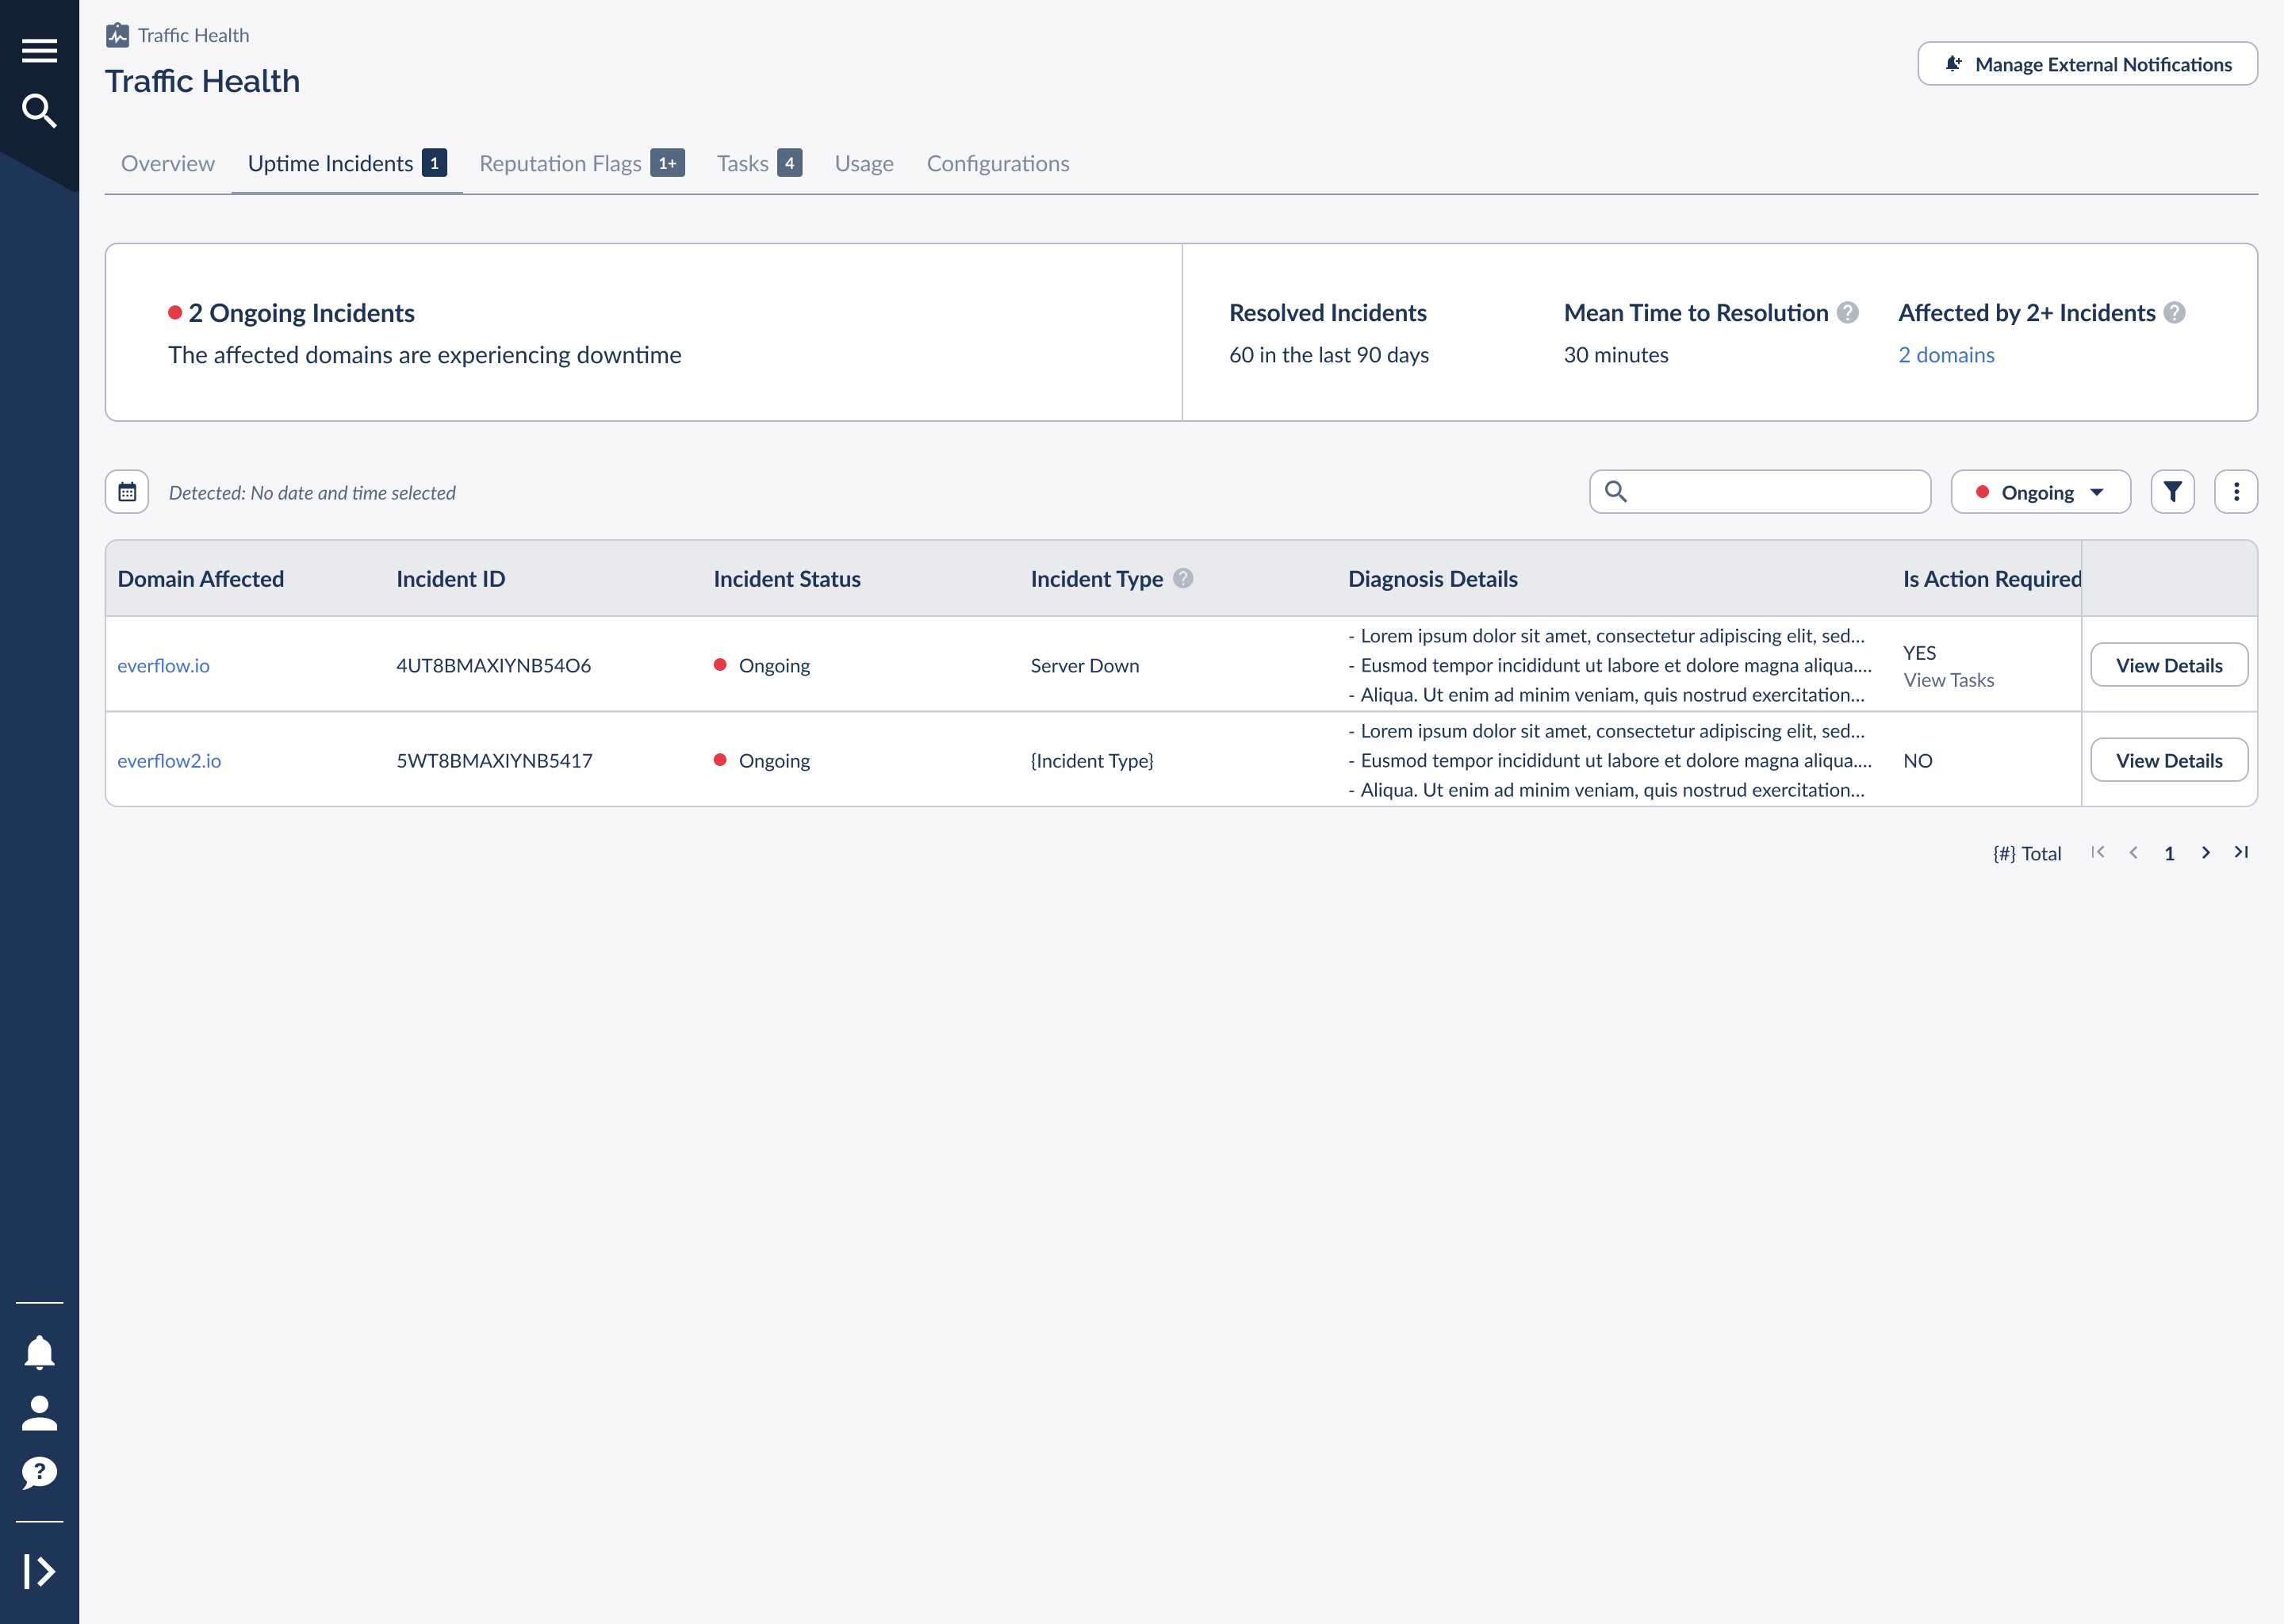
The summary surfaces four signals:
When all your domains are healthy, the band turns green and reads "All domains are up!", a fast confirmation that nothing needs you right now.

The Incidents Table
Below the summary, the table lists each incident with everything you need to understand and act on it. You can search by domain, filter by status, and narrow by detection date. The key columns are described below.
Not every incident needs you. Some clear on their own, like a transient connectivity blip that recovers before you'd even have time to react. When a row shows Is Action Required: YES, that's Traffic Health telling you the fix is on your side: a domain to renew, a certificate to update, or a DNS record to correct.
Incident Details & Lifecycle
Every incident follows the same lifecycle, which is what lets the timeline and the summary metrics stay accurate:
Detected
Traffic Health observes that the domain has gone down and opens an incident, stamped with the detection time.
Ongoing
The incident stays open while the domain is still down. Traffic Health keeps re-checking and records the last time it observed the problem.
Resolved
Once the domain responds normally again, the incident closes with a resolution time, and the gap between detection and resolution feeds into your MTTR.
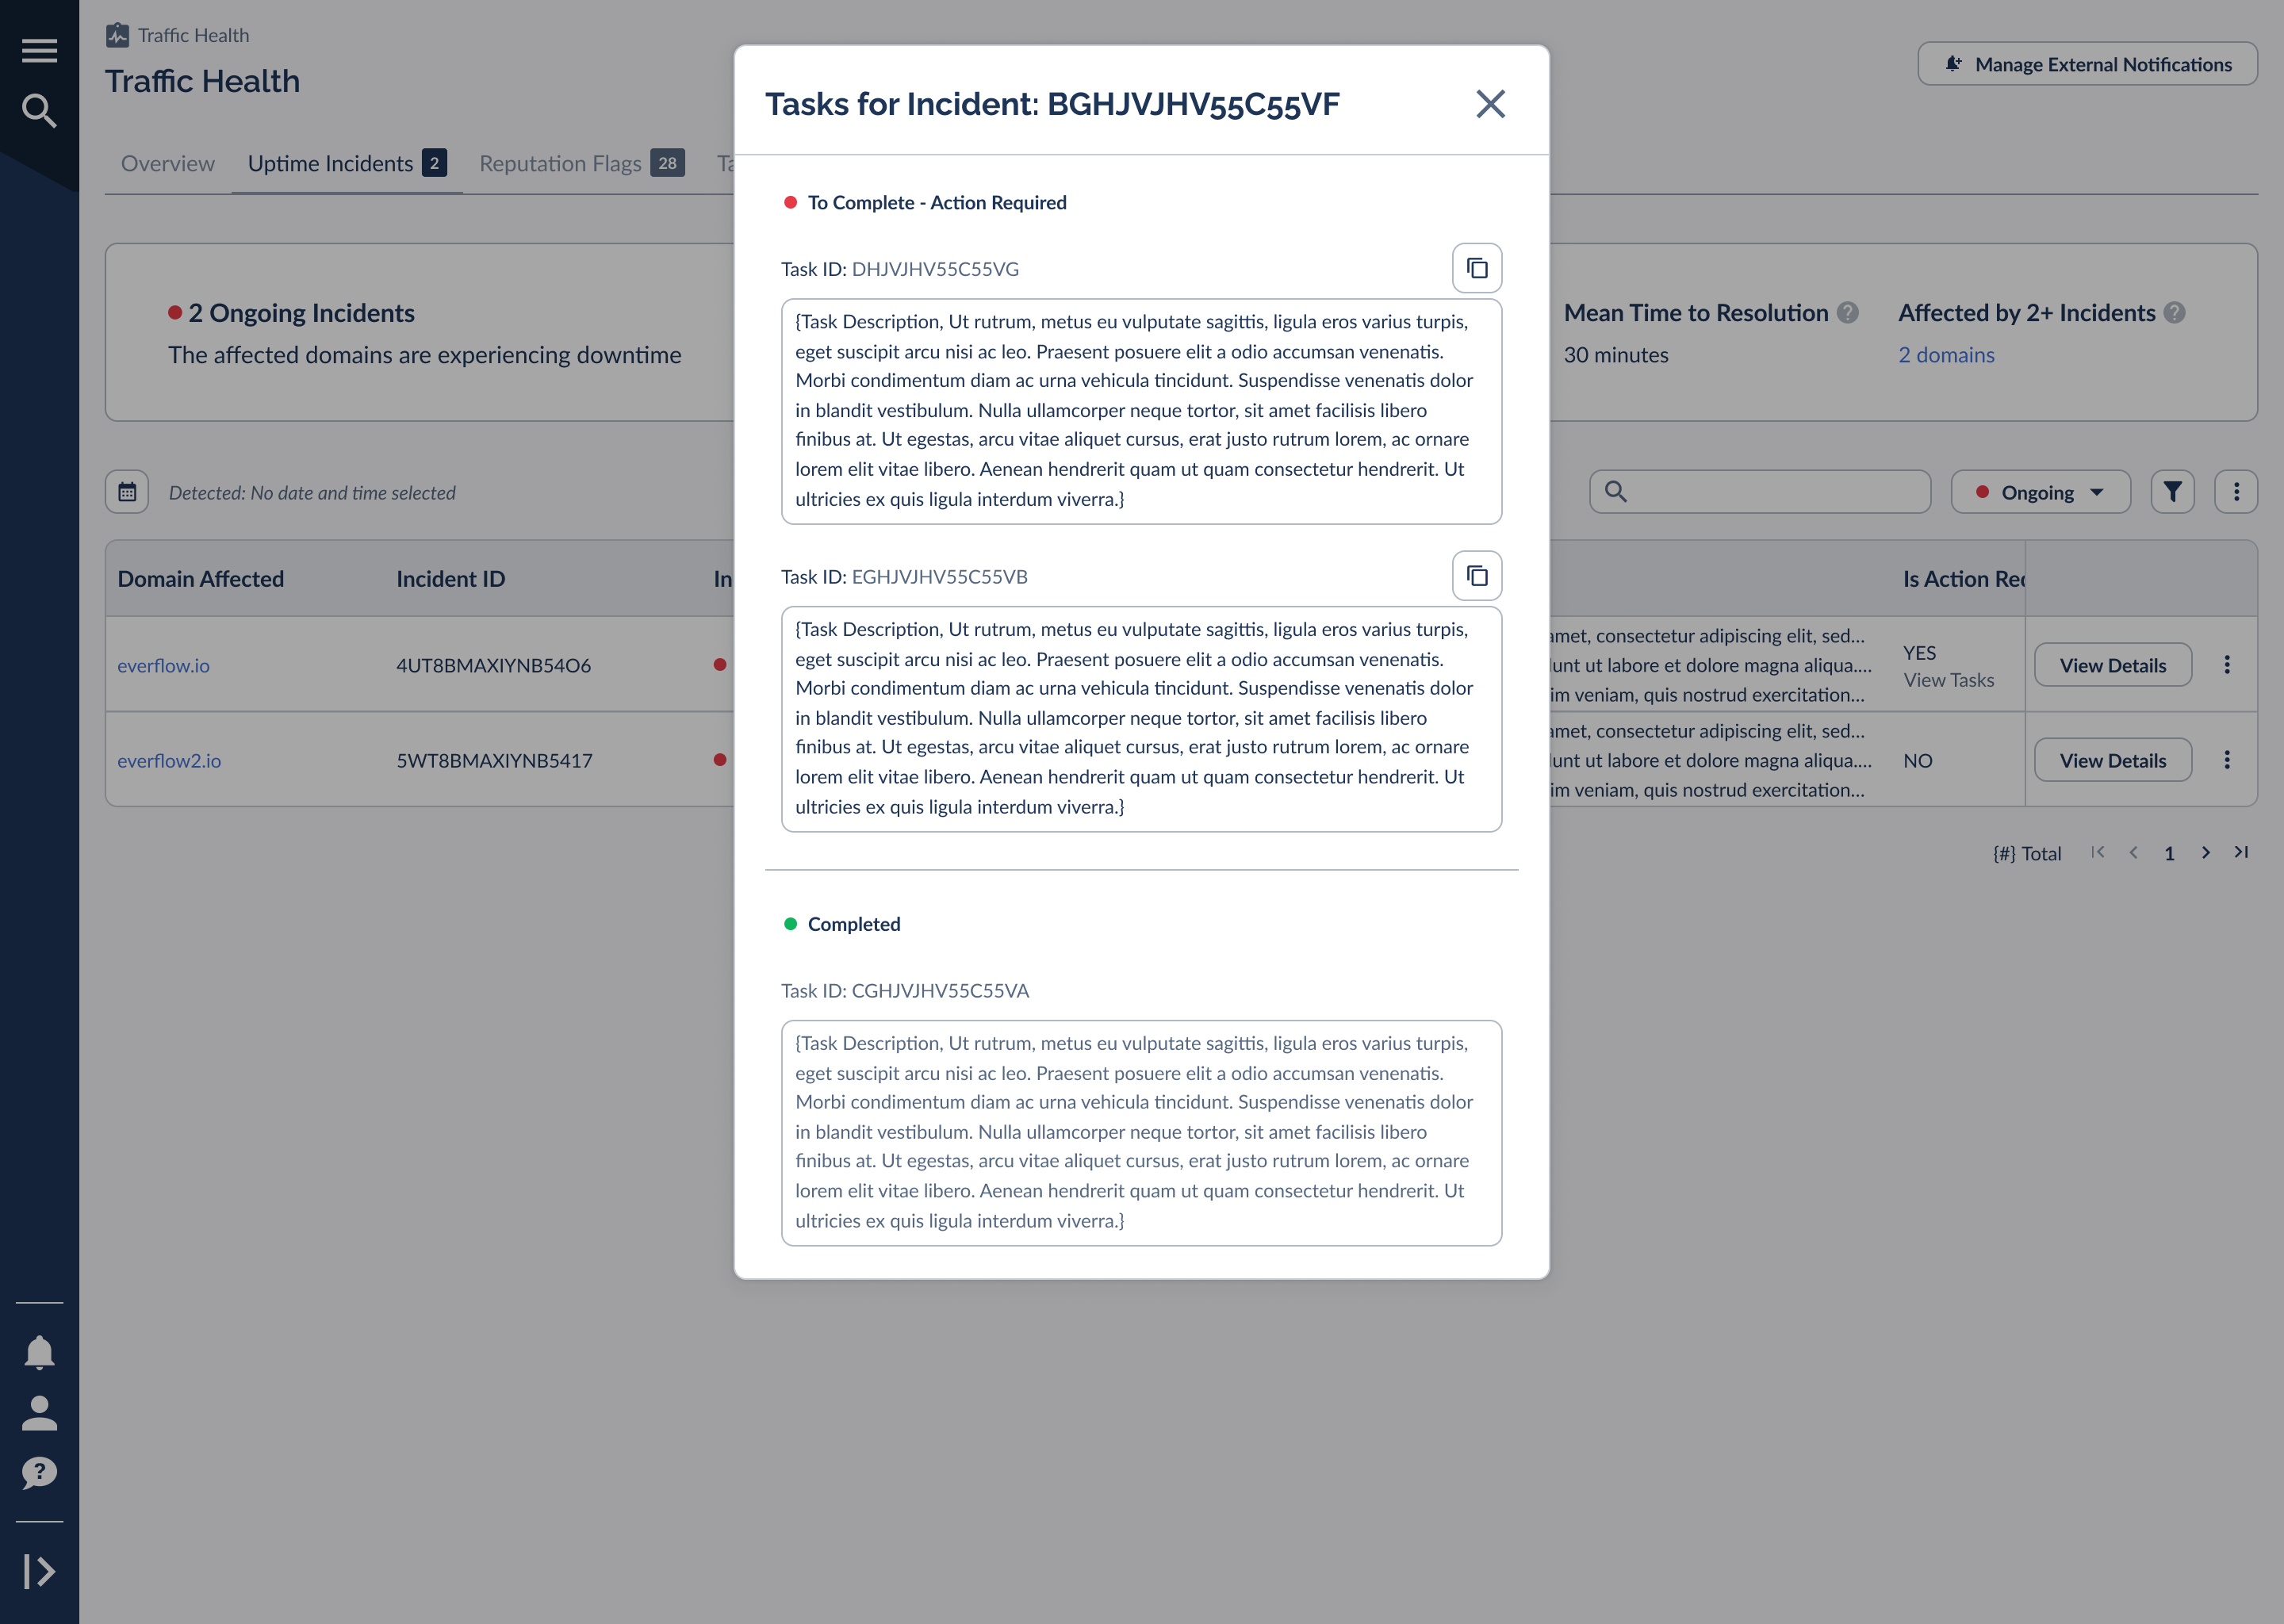
Open an incident to see its full diagnosis and, when relevant, the partners and offers running on the affected domain, so you can gauge the real business impact while you work the fix. When an incident requires action, it links directly to its tasks. Selecting that link opens the tasks grouped by status, each with copy-ready instructions for the fix.
Domains With Repeat Incidents
A domain that goes down once is an incident; a domain that goes down again and again is a pattern worth investigating. The "Affected by 2+ Incidents" metric in the summary band links to a focused view of your repeat offenders.
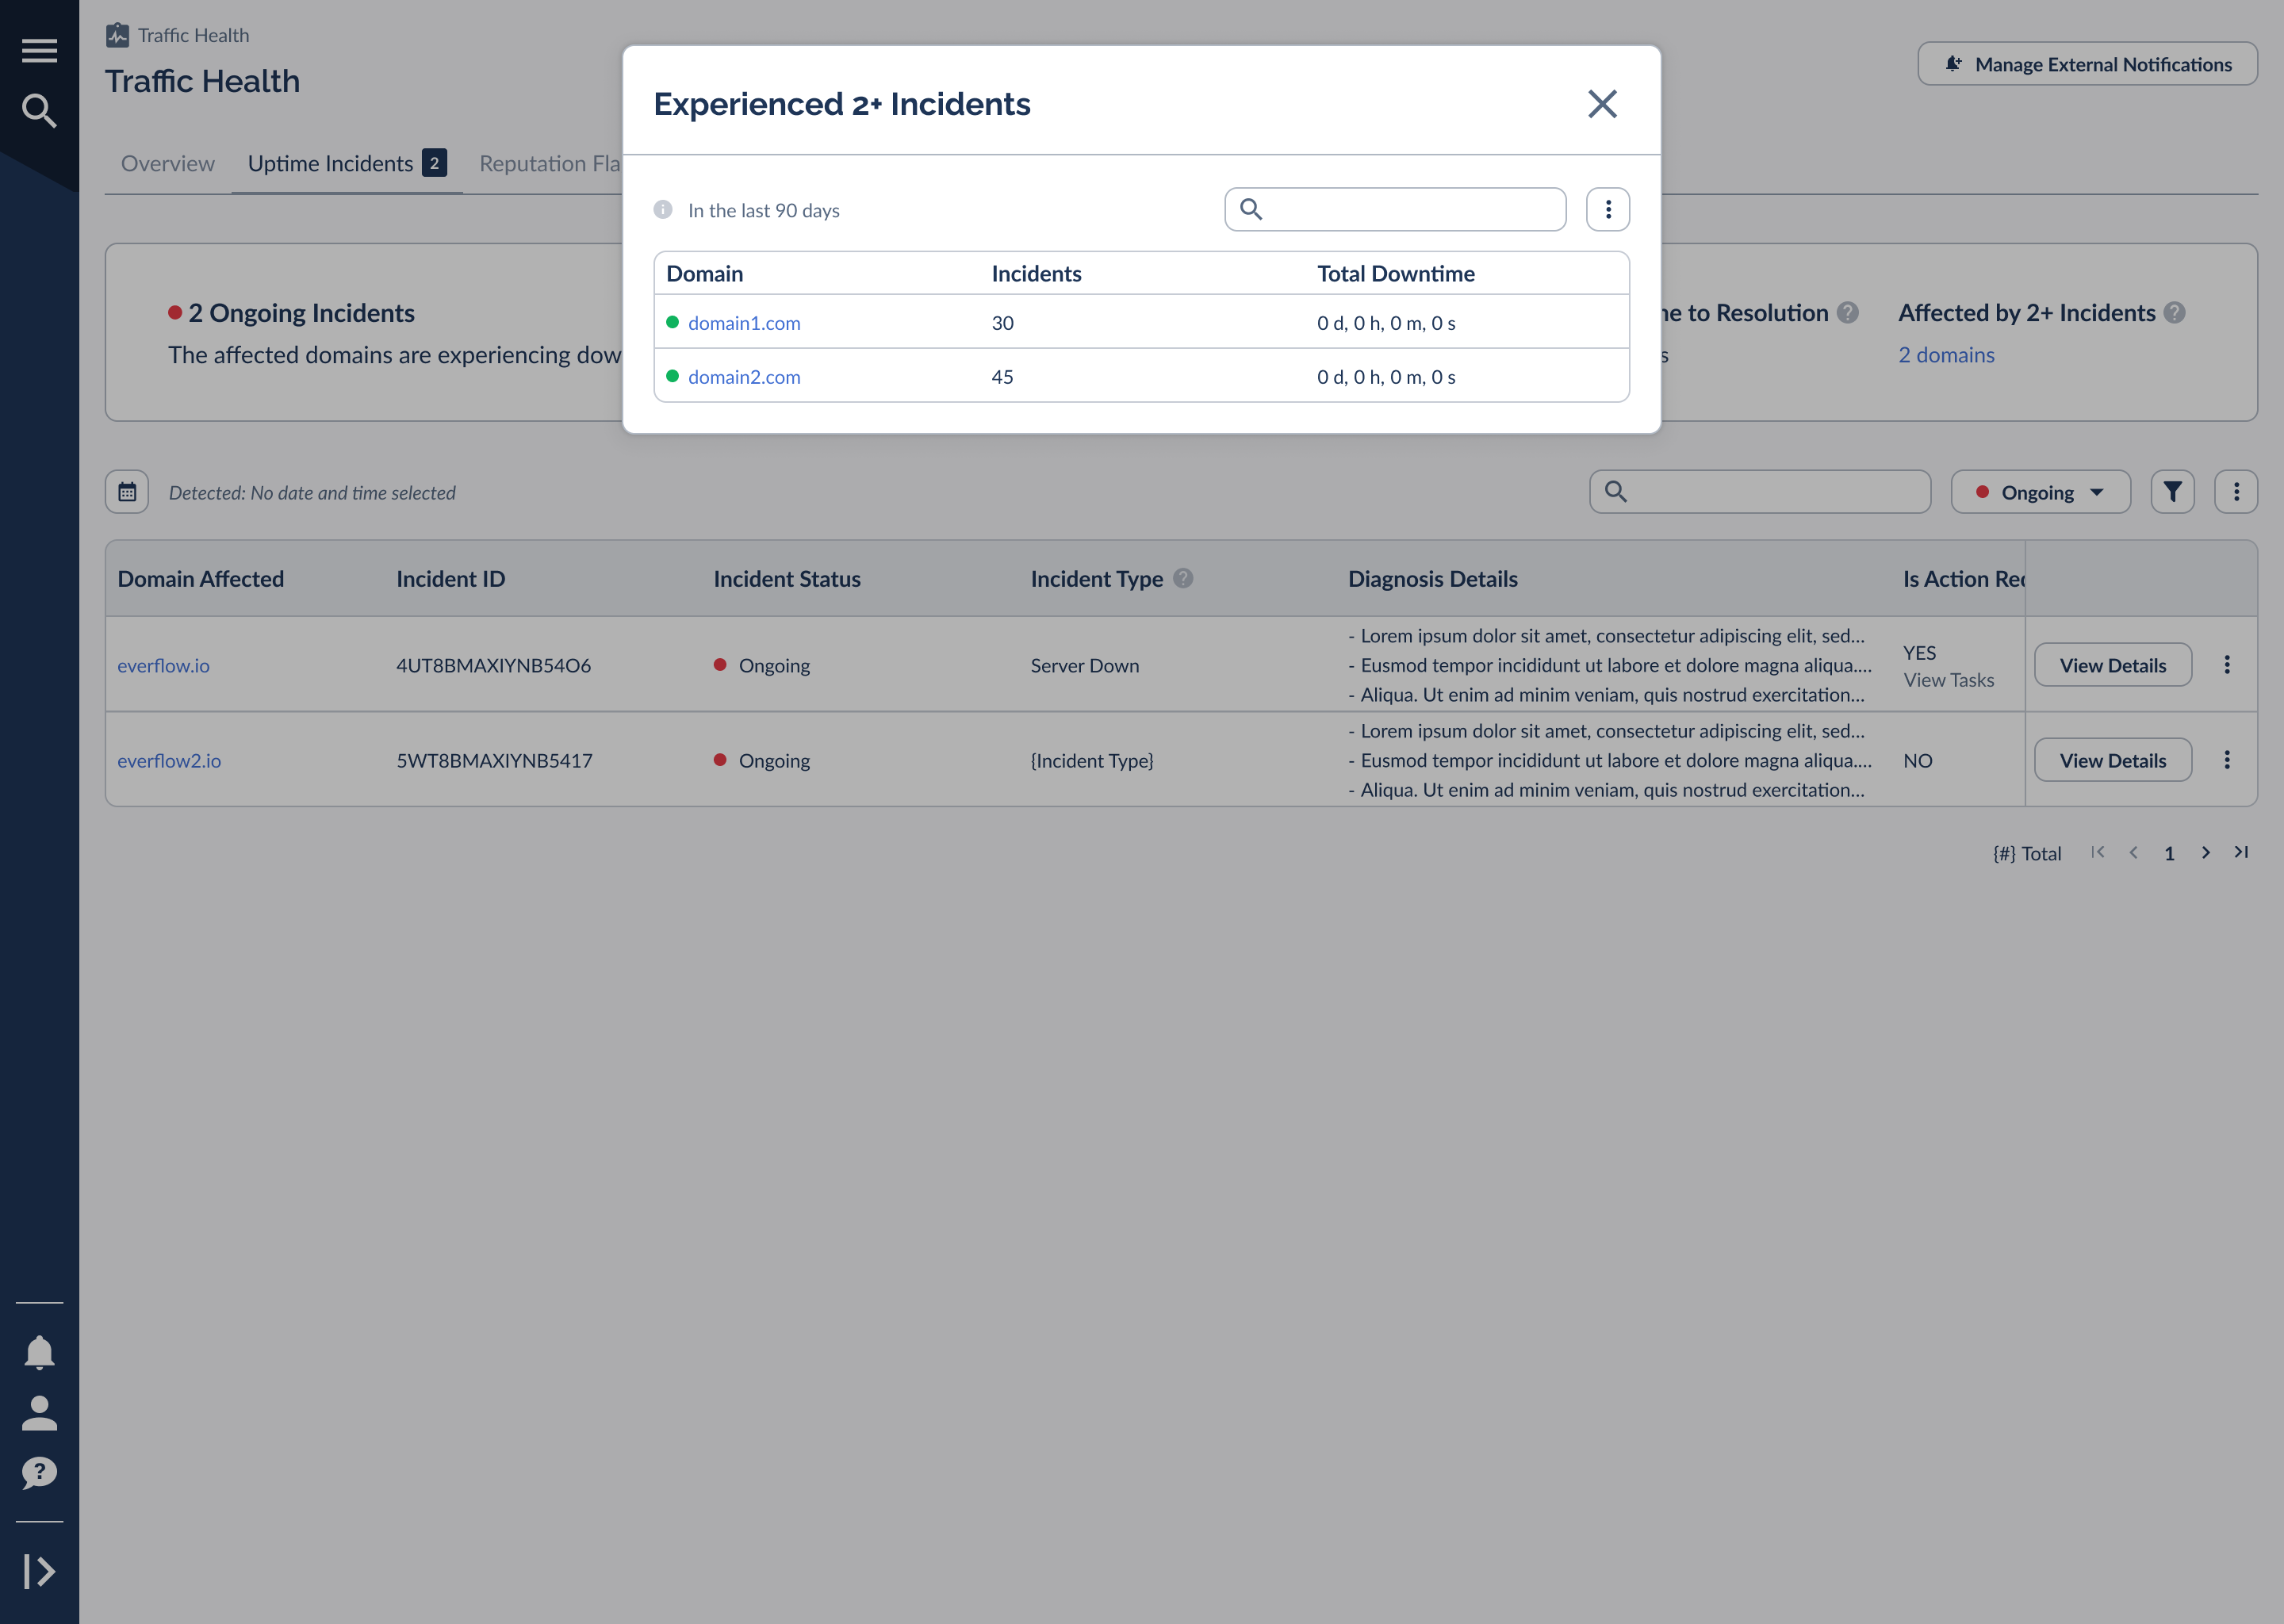
For each domain it shows the number of incidents and the total downtime accumulated over the last 90 days. If the same domain keeps surfacing here, that's a strong signal to look at its underlying setup (the hosting, the certificate renewal process, or the DNS configuration) rather than treating each outage as a one-off.
The 90-Day Uptime Timeline
Alongside the incidents table, Traffic Health shows a 90-day uptime timeline for each domain. It's a compact strip of cells, one per day, that turns a domain's recent history into a single glance: green days are healthy, and red days had a downtime incident.
Hovering any day reveals what happened. A healthy day simply confirms the domain was up.
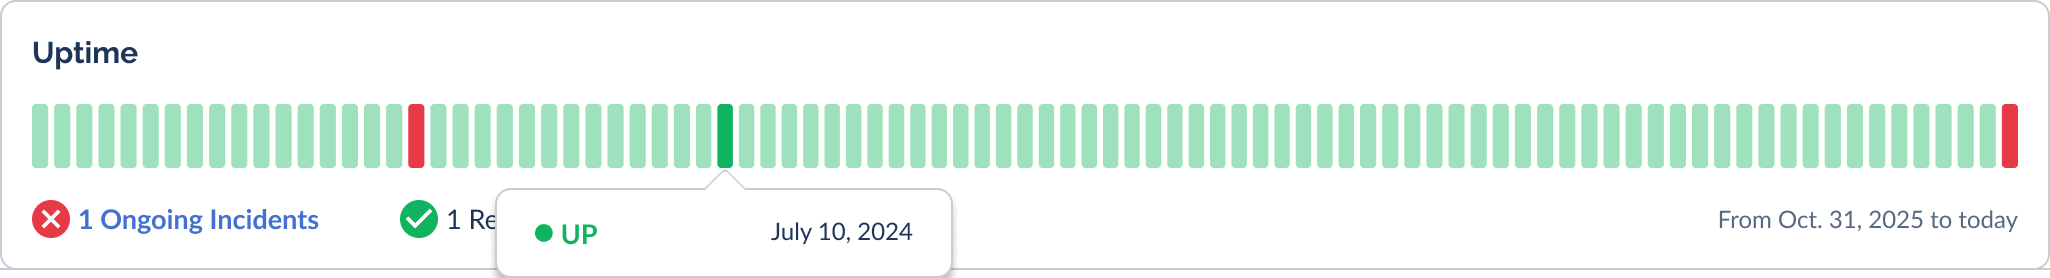
A day with an incident tells the fuller story. For a resolved incident, the tooltip shows when it was detected, when it was resolved, and the total time to resolve, then links straight to the resolved incident. For an incident that's still open, the tooltip shows the detection time and the last time the problem was observed, with a link to the ongoing incident.
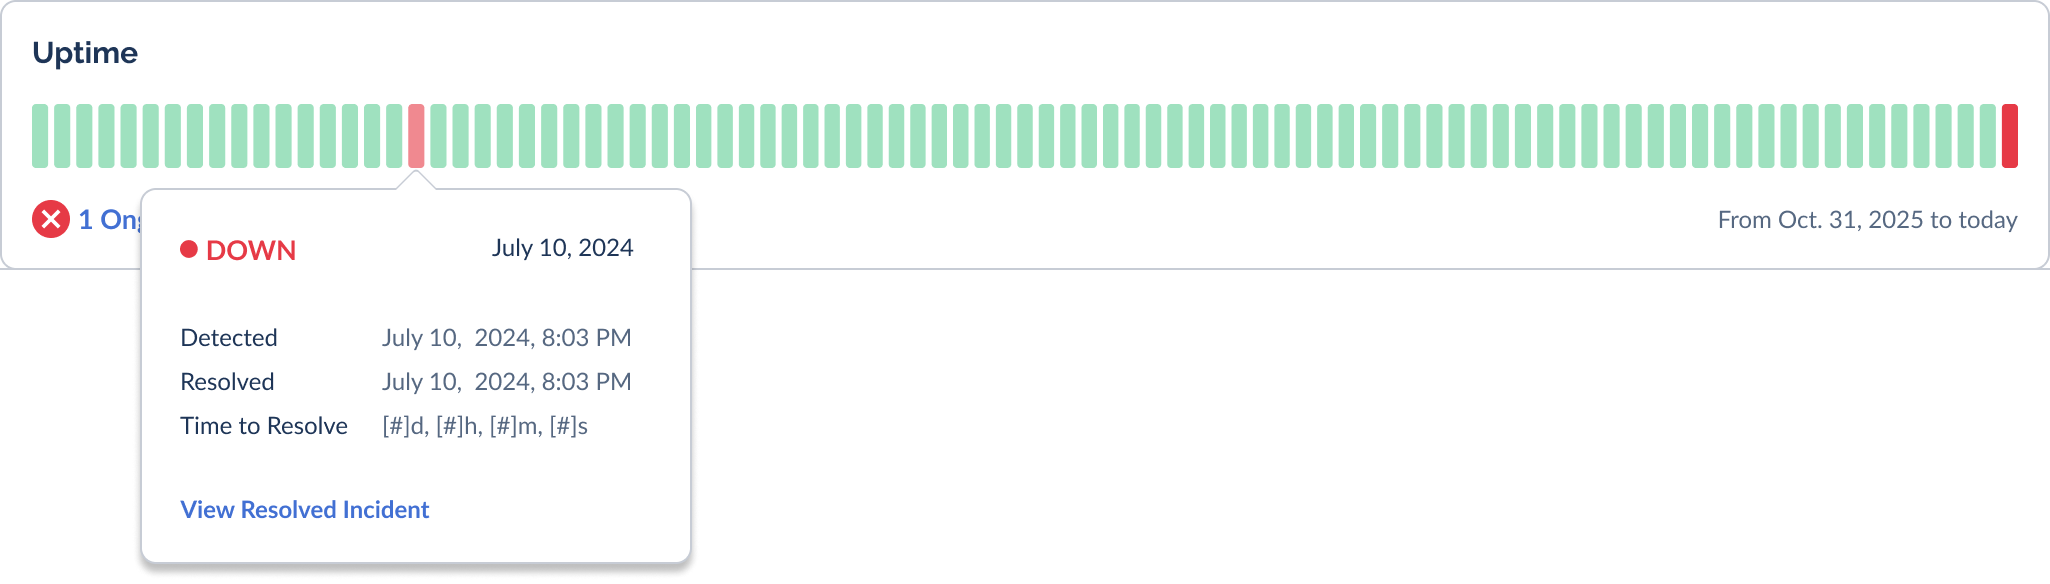
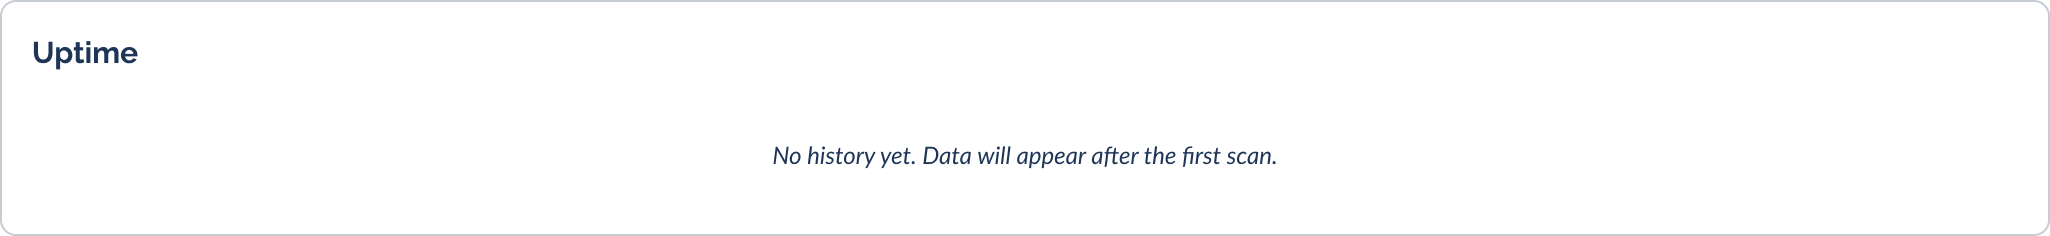
Newly added domains won't have history yet. Until the first scan completes, the timeline shows an empty state, then begins filling in from the right as days accumulate.
The Reputation Flags Tab (Premium)
Open
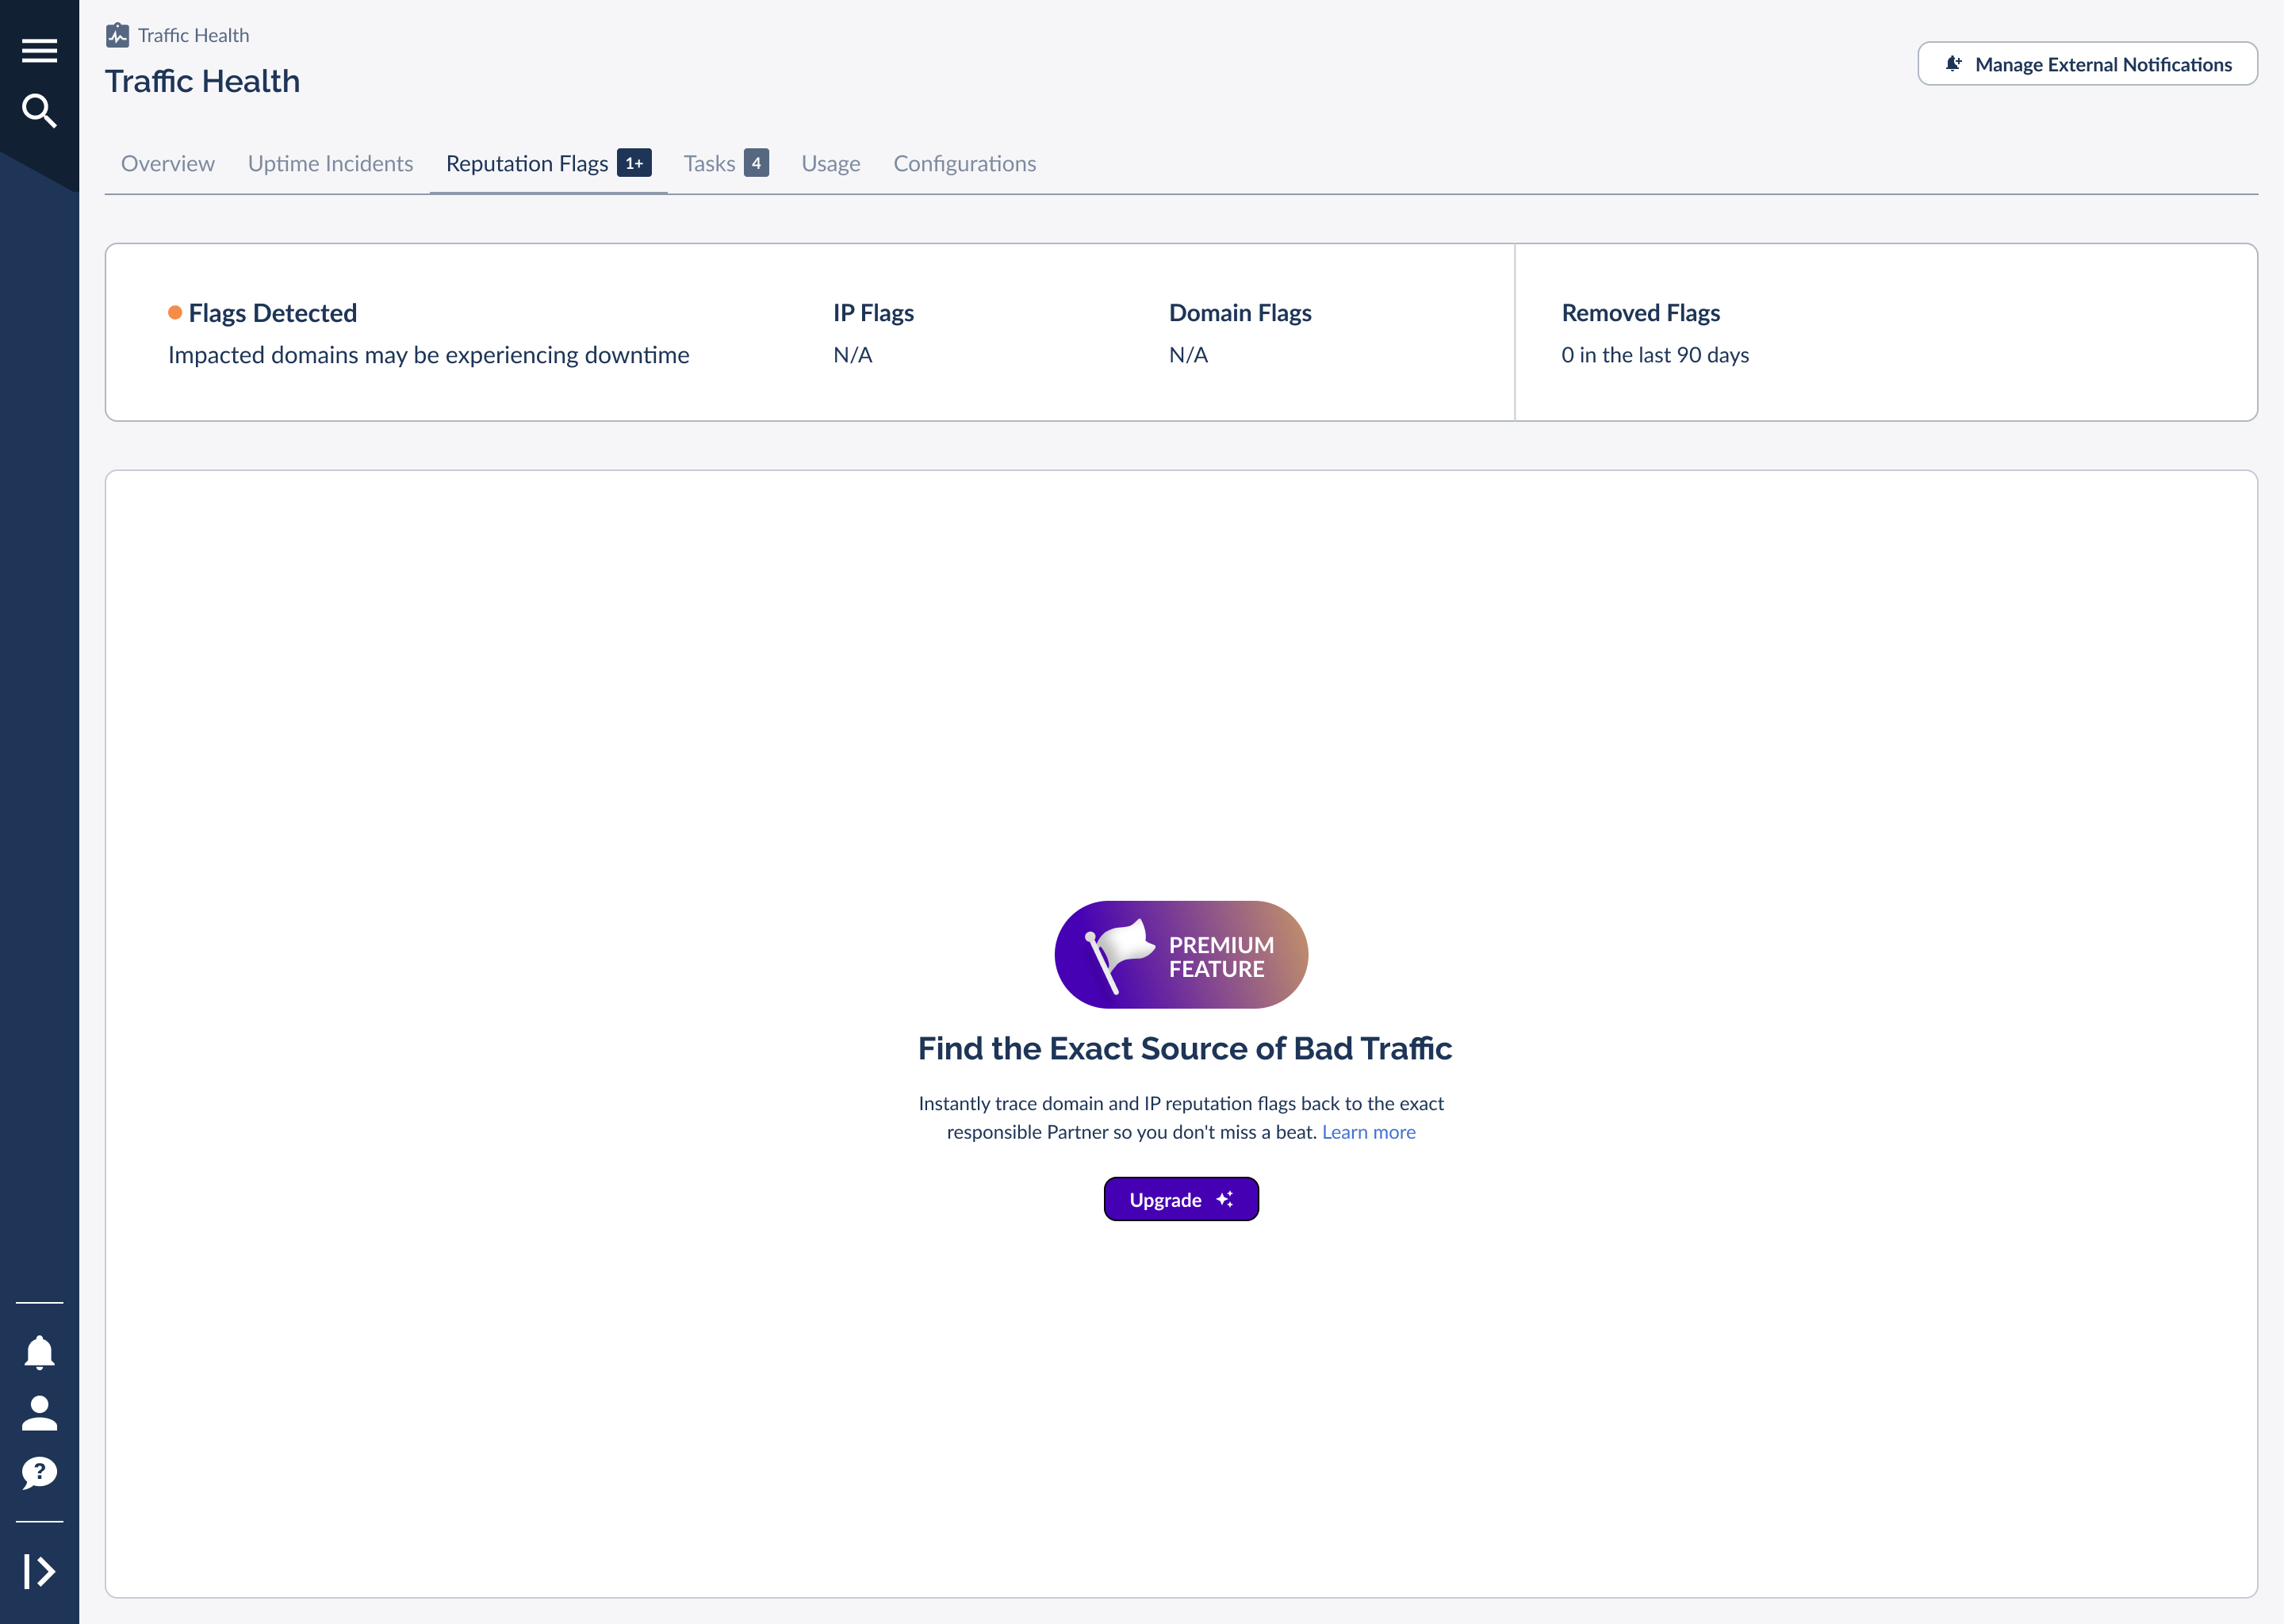
For details on what's included in each plan and how to upgrade, see the packages and billing article linked at the end. The rest of this section describes the Premium experience.
What a Reputation Flag Means
A reputation flag is raised when an external reputation or threat-intelligence source adds your domain or its IP to a list of addresses associated with suspicious or unwanted activity. Even if the domain is technically up, a flag can cause downstream systems (email providers, ad networks, security filters) to block or de-prioritize your links. That's why a flagged domain can experience the kind of quiet delivery loss that uptime monitoring alone wouldn't catch.
Traffic Health checks your domains and IPs daily against a range of these external sources and consolidates what they report into a single, readable view, so you don't have to monitor each source yourself.
Types of Reputation Flags
Flags are grouped by their underlying cause, so you can tell at a glance what kind of problem triggered them. The Flag Cause column on each flag uses these categories:
Malicious Activity
The domain or IP was associated with malware, phishing, or other harmful behavior by a threat-intelligence source.
Spam/Abuse
The domain or IP appears on an anti-spam or abuse blacklist, often tied to unsolicited messaging or abusive traffic.
Tracking/Advertising
The domain was added to an ad- or tracker-blocking list, which can cause browsers and extensions to block its links.
Each flag also records whether the domain's underlying IP is itself flagged. An IP-level flag matters because a single IP can host several of your domains, so one bad neighbor can put multiple domains at risk at once.
Reputation monitoring draws on several named reputation and threat sources, so you find out fast if a domain or Dedicated IP lands on a blocklist:

Google Threat Intelligence
Flags domains and URLs tied to malware, phishing, and other malicious activity, drawing on Google's global threat data.
Visit Google Threat Intelligence ↗
HetrixTools
Monitors your domains and Dedicated IPs against dozens of major blacklists in real time.
Visit HetrixTools ↗EasyList
A widely used open filter list that identifies domains serving intrusive ads and trackers.
Visit EasyList ↗Domain, IP & Partner Attribution
The Premium Reputation Flags tab organizes everything into three views so you can move from "something is flagged" to "here's exactly who and what is involved."

The partner view is the piece that turns reputation monitoring from "we have a problem" into "we know whose traffic caused it." Instead of guessing, you can trace a flag to the exact partner and have a specific conversation about the traffic they're sending.
Drilling Into Flagged URLs
A domain-level flag can involve specific URLs rather than the whole domain. Opening a flag's URLs Included view lists each flagged URL alongside the partner using it and the offer it's running for.
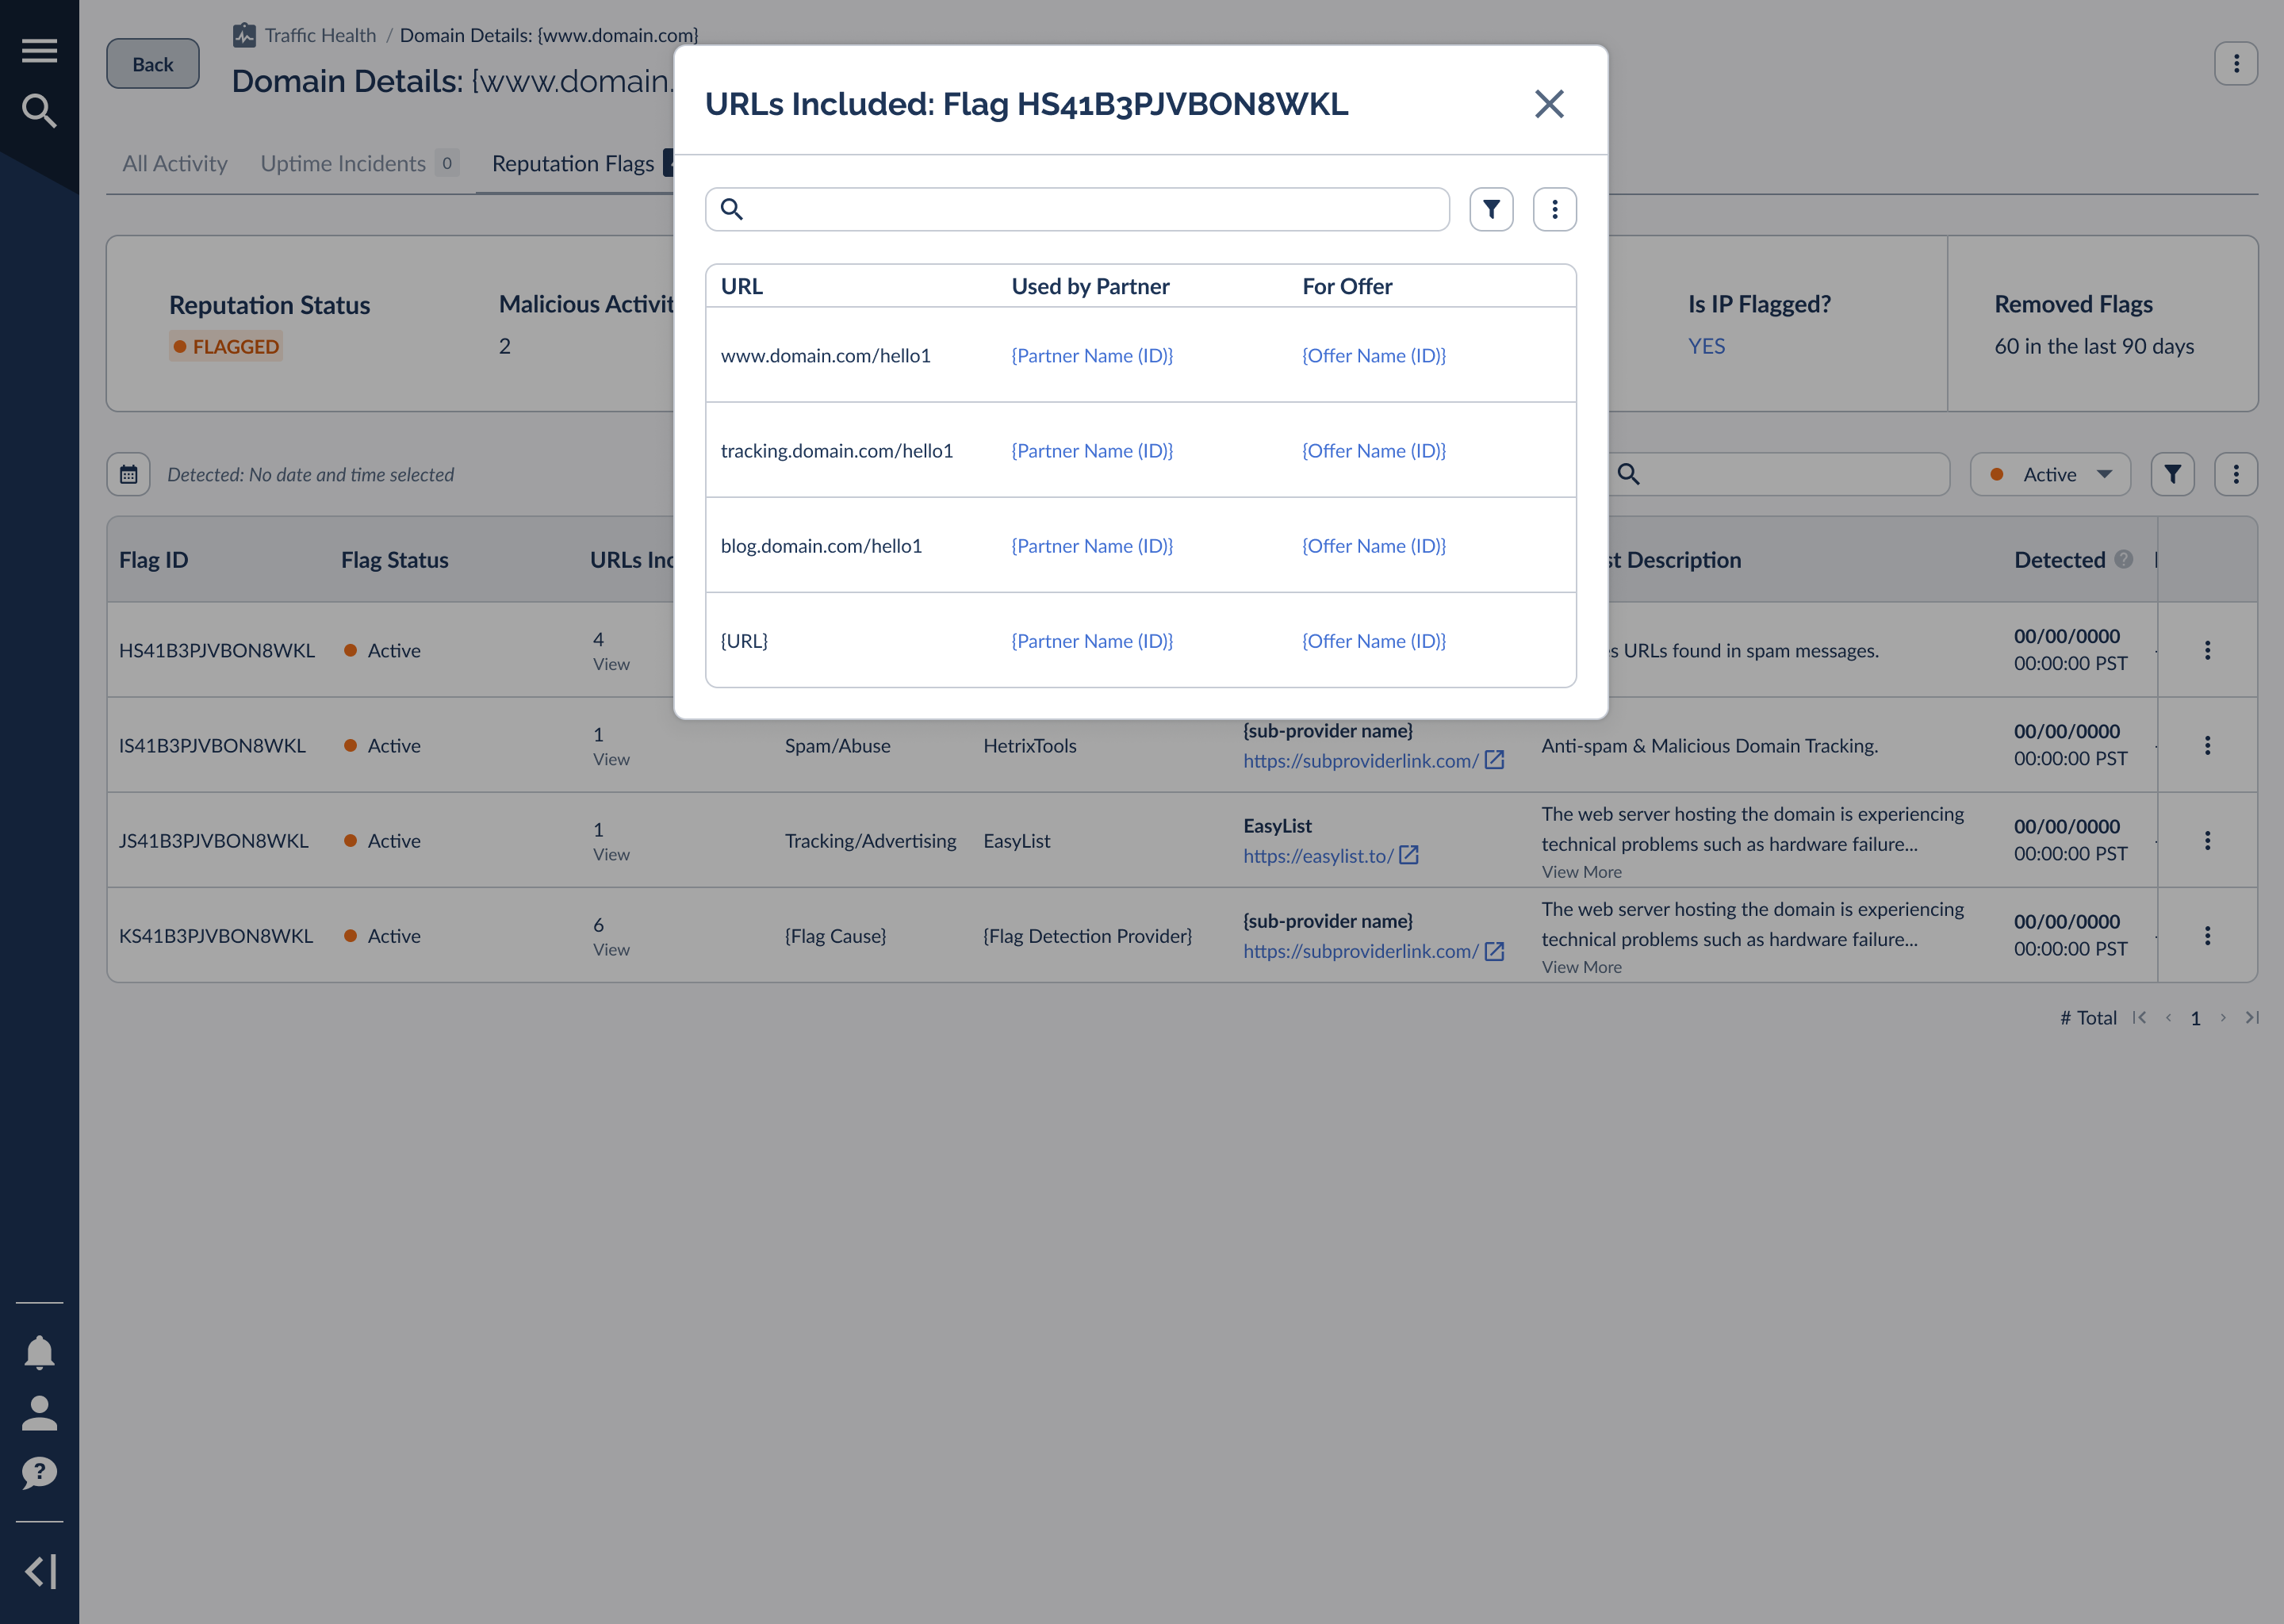
URL-level attribution is the fastest way to isolate low-quality traffic. When a flag points to a handful of URLs, check which partners and offers are behind them. You can often resolve the flag by addressing one partner's traffic rather than touching the whole domain.
Removed Flags & Delisting
Flags don't stay forever. Once the underlying issue is addressed and the external source clears the listing, the flag moves from active to removed. The Reputation Flags tab tracks how many flags have been removed in the last 90 days, so you can see your reputation recovering over time.
To speed recovery, an individual flag offers delisting information: the steps and references for requesting removal from the source that raised it. Filtering the tab by status (Active, Removed, or All) lets you focus on what still needs work versus reviewing what's already cleared.
Tasks: Resolving What Needs Your Attention
When something needs action on your side, Traffic Health turns it into a task: a concrete step you can take to fix an issue or get ahead of one. Everything you see here is yours to handle. Traffic Health only shows the tasks that are relevant to you, so Everflow's own internal maintenance never clutters your list.
Tasks come in two urgency levels:
Each task carries copy-ready instructions describing exactly what to do: for example, confirming a domain is pointing to the correct server, completing a verification step before a deadline, or checking for a renewal or payment notice. Open a task's instructions to read the full description and copy it.
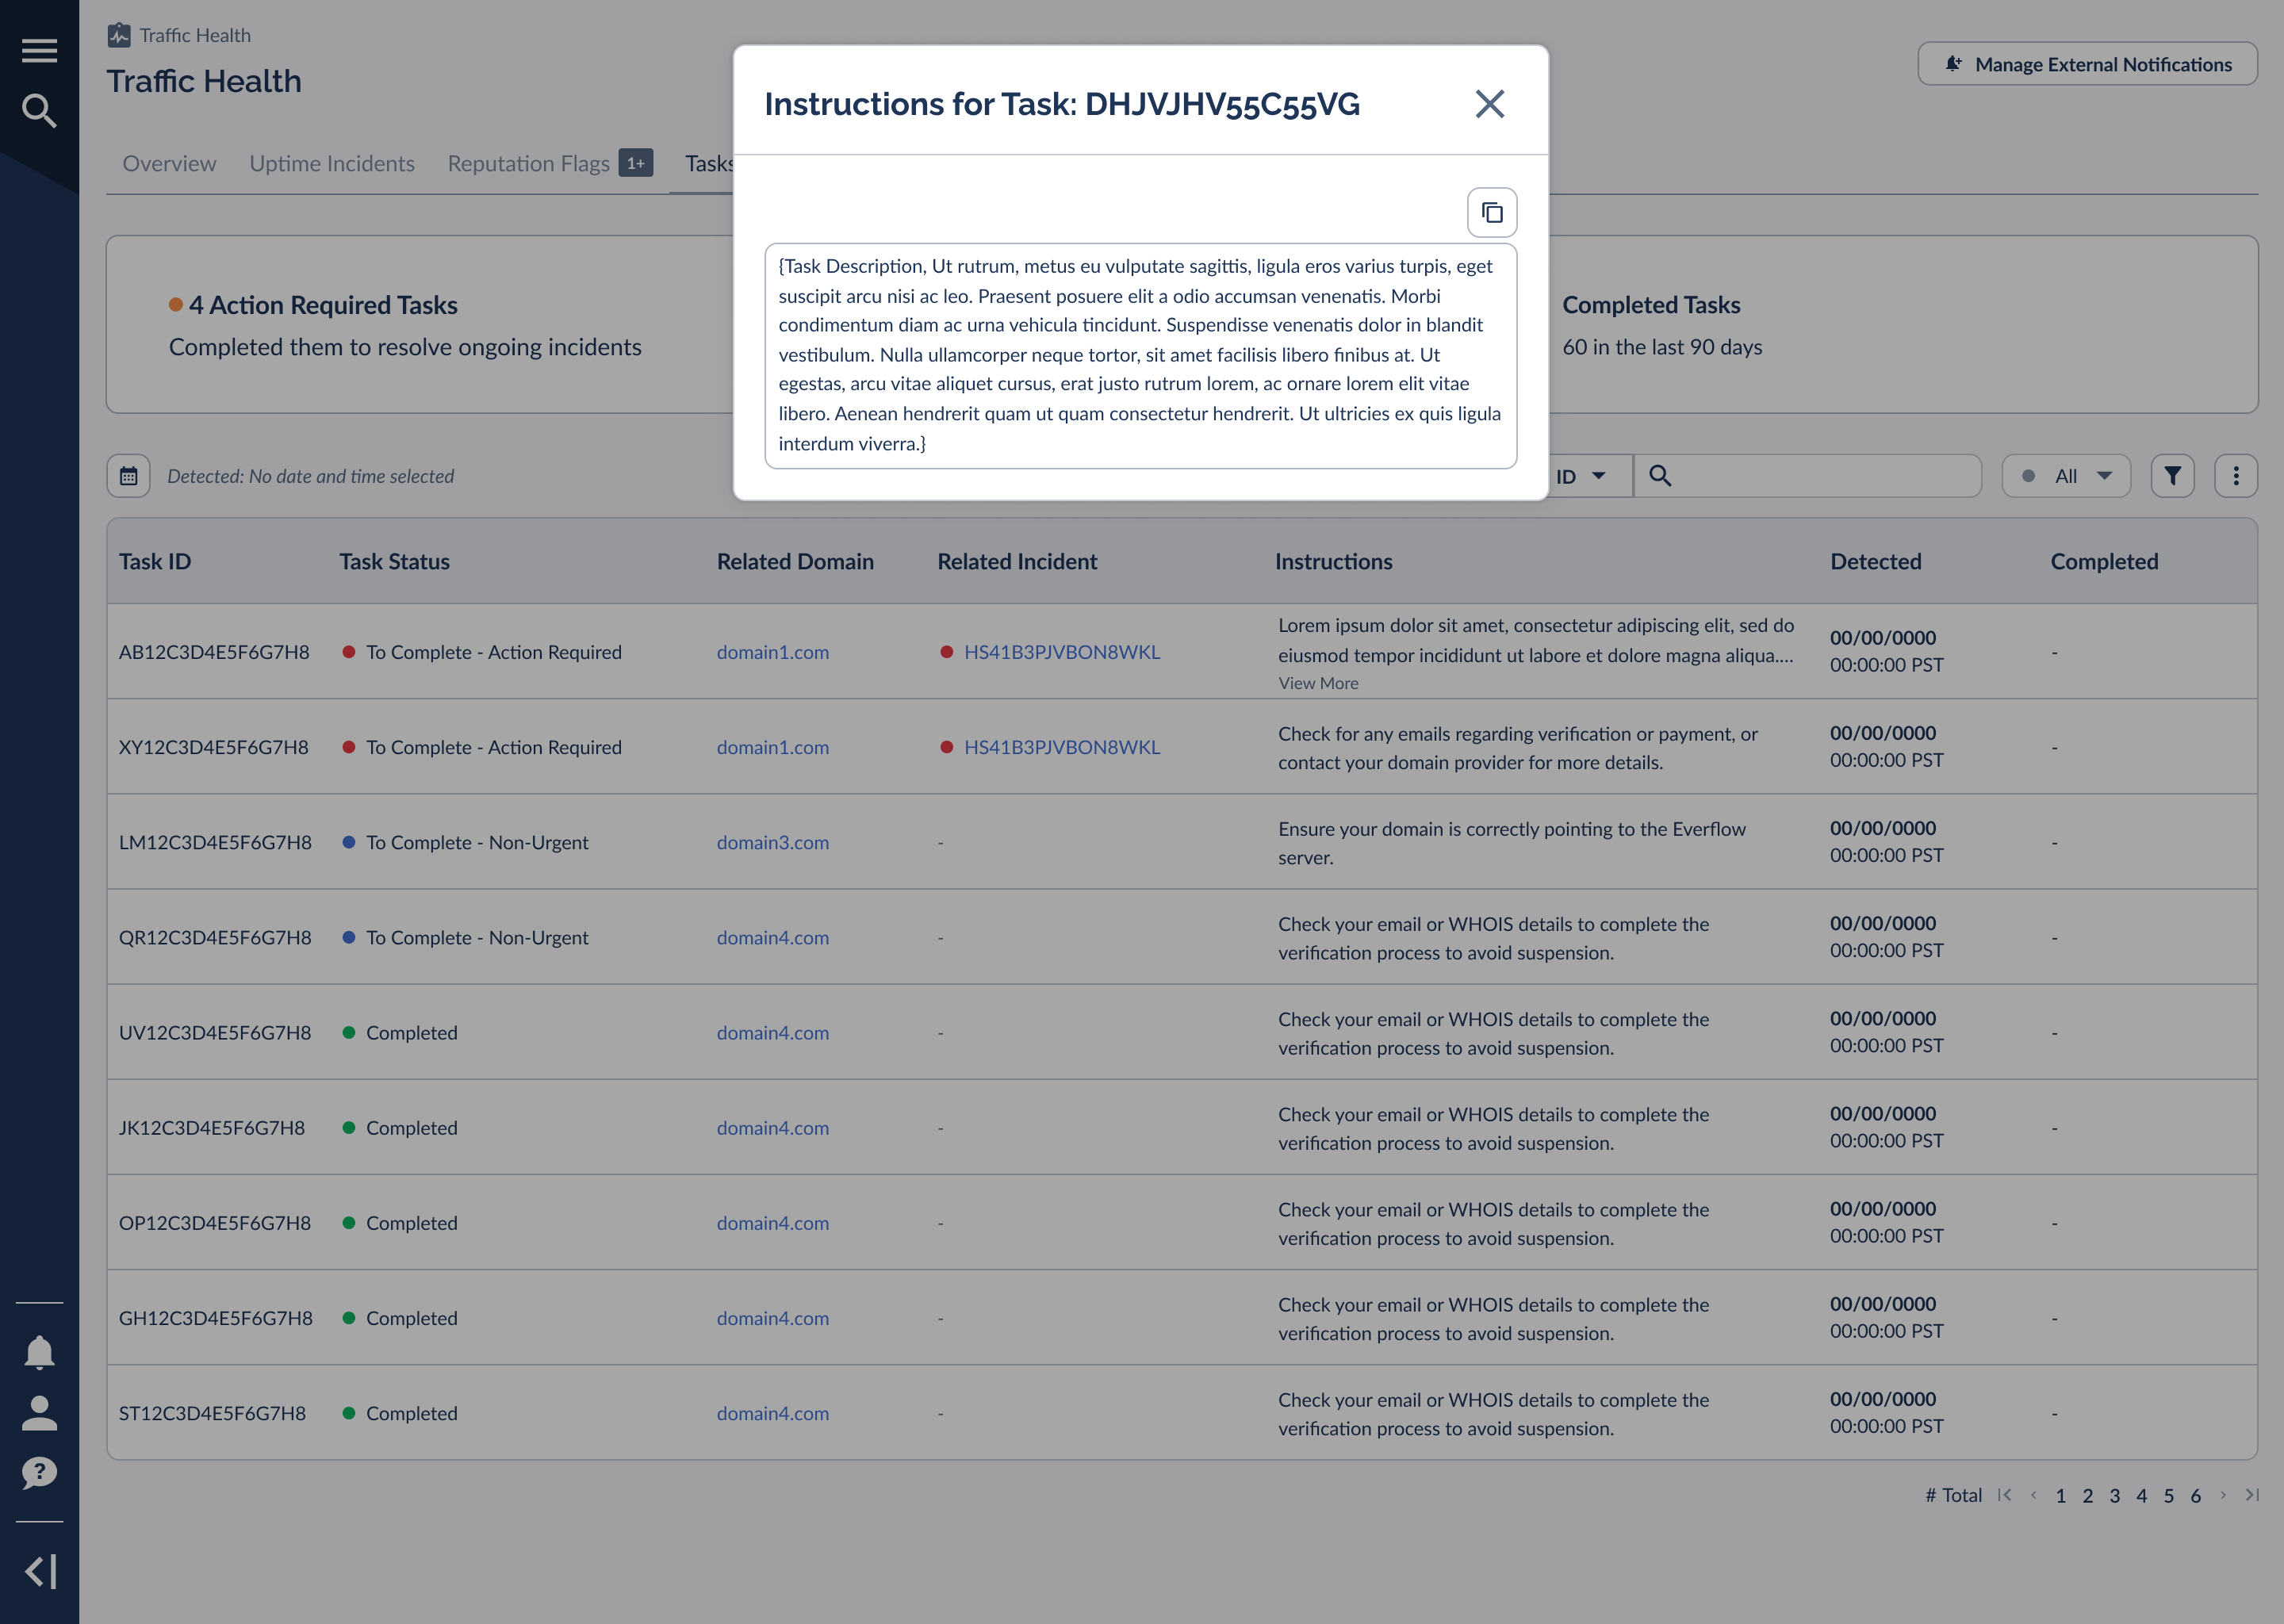
You can review tasks where they surface on each domain and from the incidents that generated them, filtering by status to separate what still needs action from what's already complete. Clearing your Action Required tasks is the most direct path to resolving an ongoing incident.
Frequently Asked Questions
A few common questions about how uptime and reputation monitoring behave.
No. Traffic Health only monitors and alerts. It will never automatically pause, redirect, or disable a domain, offer, or partner. Every action is yours to take.
Uptime is monitored in near real time, so a new downtime incident appears within minutes. Reputation is checked daily against external sources, so a new reputation flag can take up to a day to surface.
Reputation monitoring is a Premium capability. On a Basic plan you'll see a preview with an upgrade option, while uptime monitoring continues to run on every plan. See the packages and billing article for what each plan includes.
It's the average time between when an incident is detected and when it's resolved, calculated across your incidents over the last 90 days. A lower MTTR means issues are getting fixed faster.
A removed flag means the external source no longer lists the domain or IP. If you requested delisting, allow time for the source to refresh. The tab keeps a 90-day record of removed flags so you can track recovery.
→ Setting Up External Notifications
→ Traffic Health Dashboard Overview


