
Introduction
Picture this: your track.brand.com lands on a blocklist overnight, and the first you hear of it is a partner asking why their conversions dried up. Traffic Health exists so that never happens. It is your early-warning system for the domains and IPs behind your tracking, watching around the clock for downtime, reputation flags, and assignment problems, then surfacing exactly what needs your attention so you can act before partners feel a thing.
One thing to know up front: Traffic Health tells you what is wrong and why, but it does not change your setup for you. When it spots a problem, you decide how to fix it. You stay in control of every action.
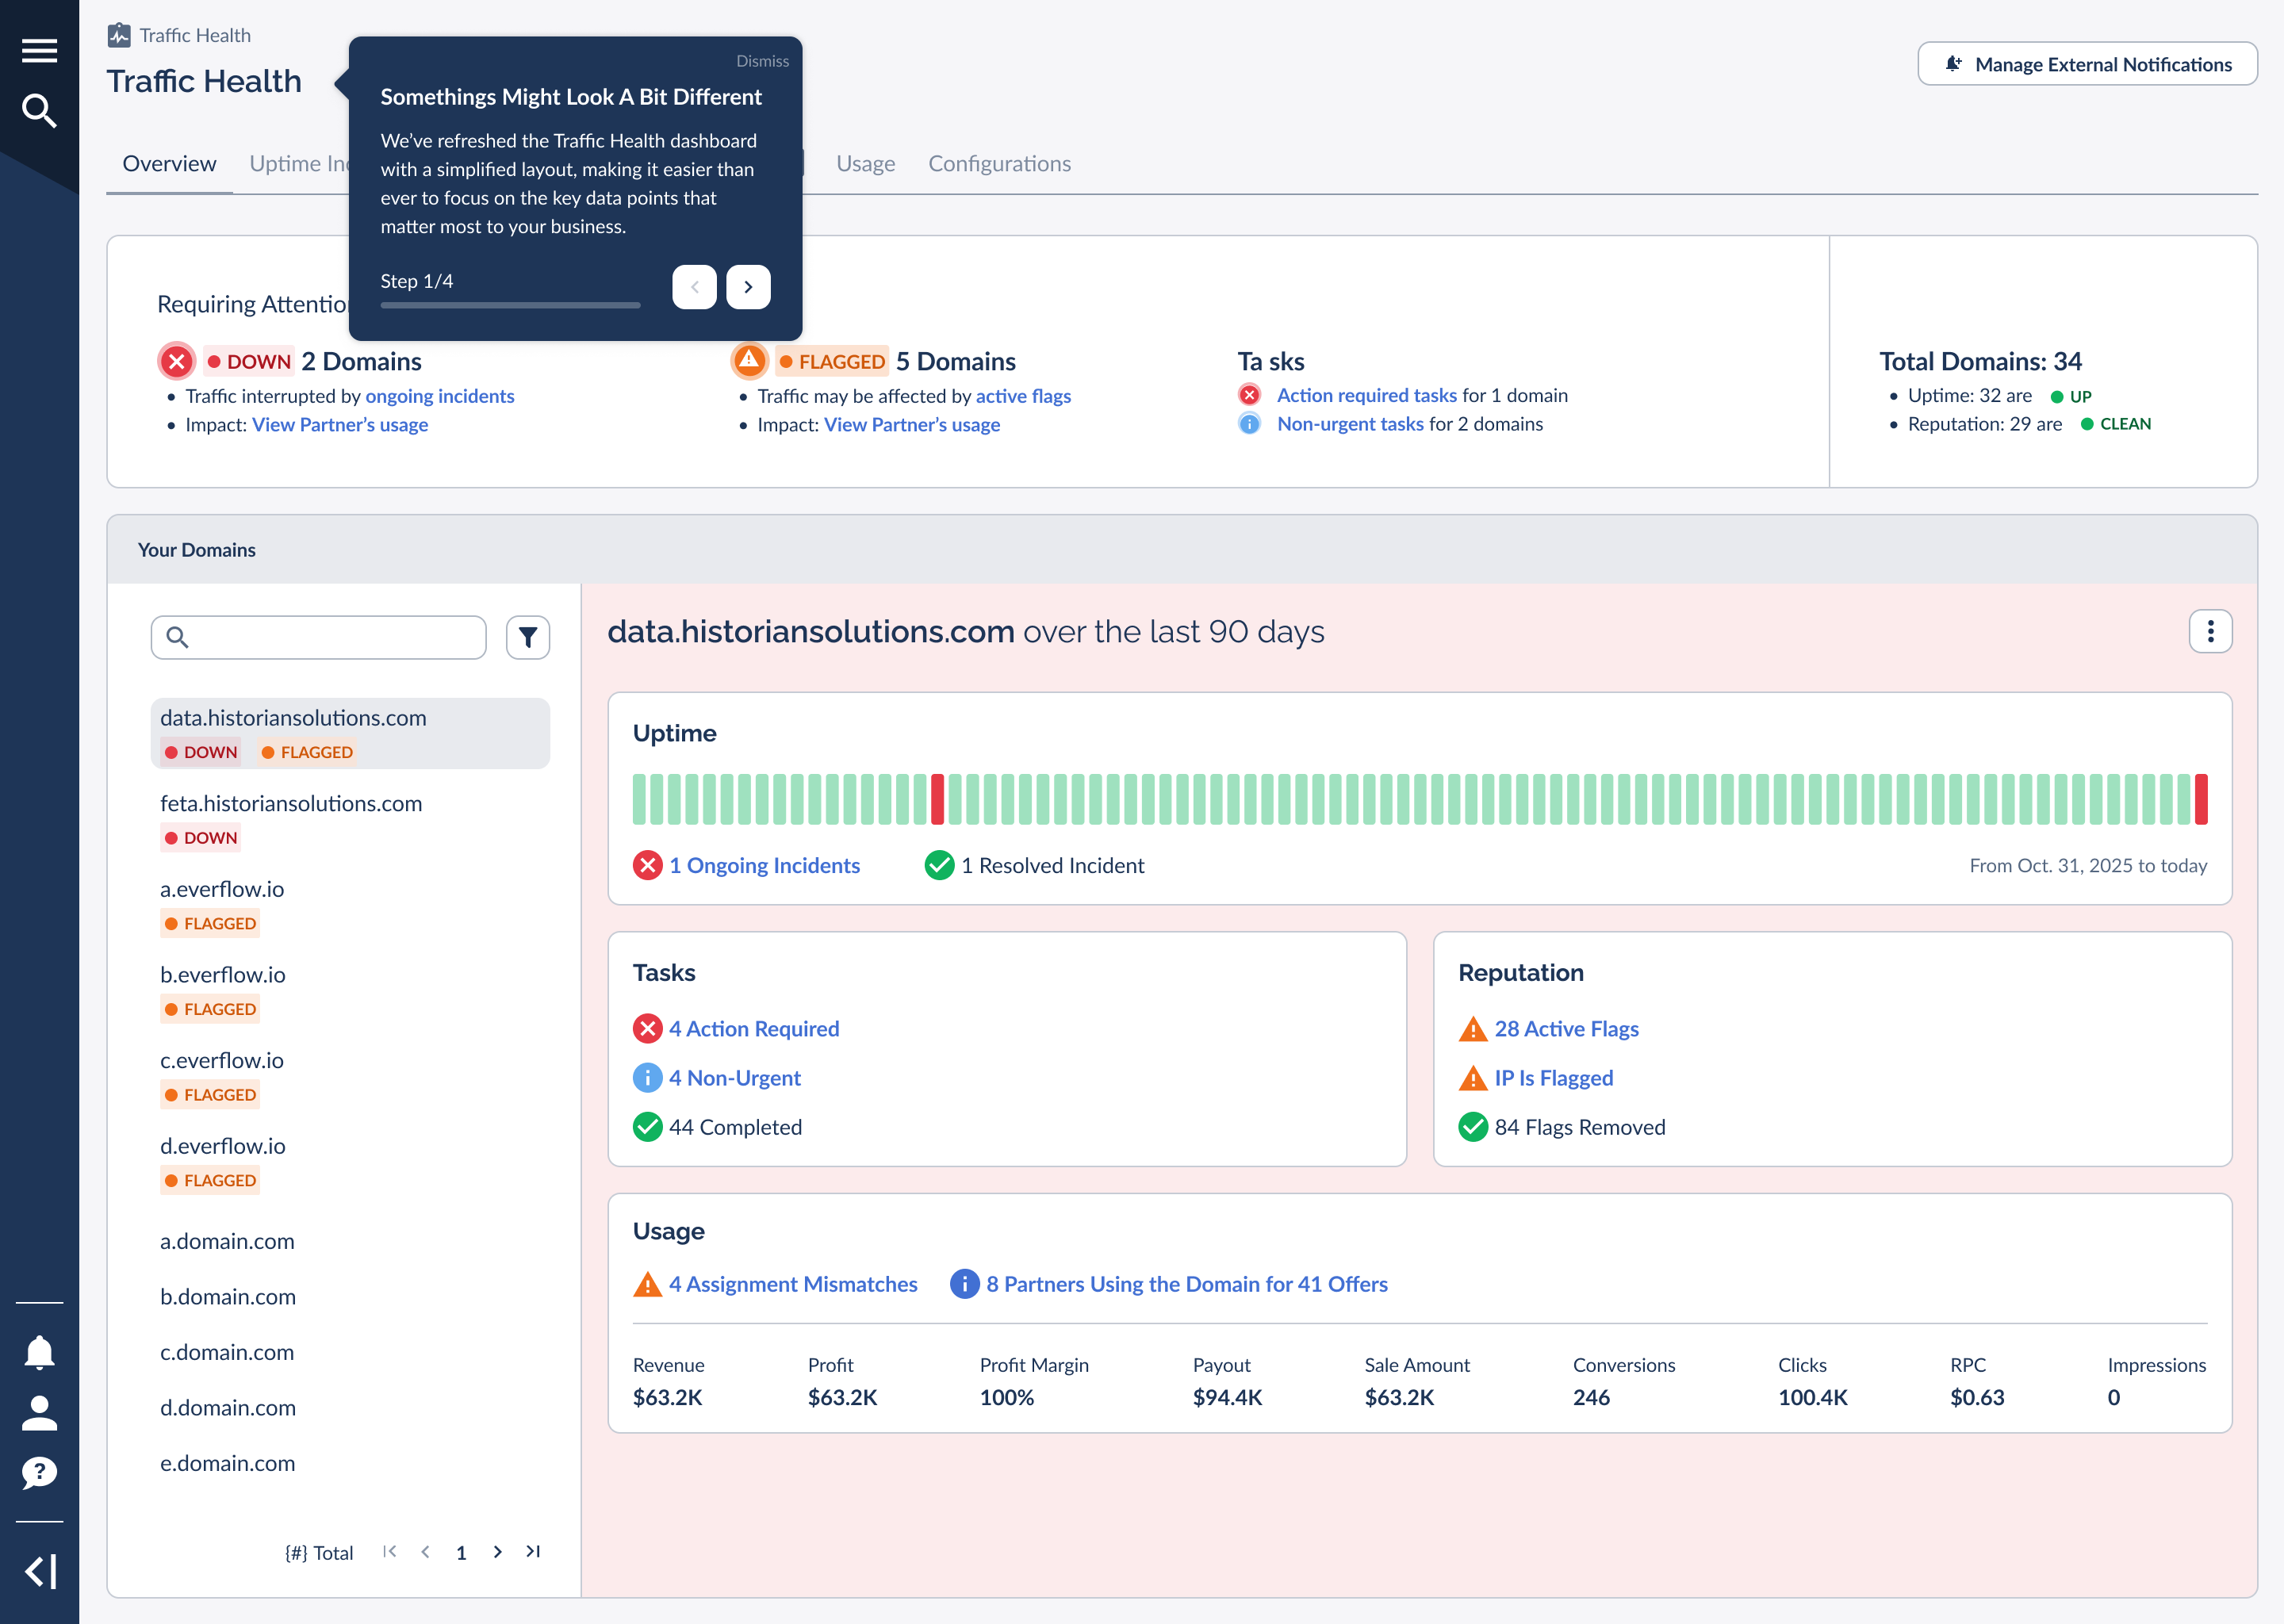
Traffic Health has also been redesigned. If you used the previous version, the layout will look different. The single, scrolling dashboard is now organized into a clean tab bar, and the old "Latest Activity" feed has moved into a dedicated per-domain view. This article walks you through the new structure so you always know where to look.
Before You Begin
Traffic Health lives in your Everflow Core Platform. Before you can open and use it, two things need to be true: you need permission to view it, and your account needs an active monitoring plan.
Who can access Traffic Health
Access to Traffic Health is controlled by your user permissions. If you do not see Traffic Health in your navigation, your role likely does not include access yet. An administrator on your account can enable it for you from your user settings.
Basic vs Premium at a glance
Traffic Health comes in two tiers, and which one you have determines how much of the dashboard is populated. Both tiers monitor uptime. Premium adds reputation intelligence, partner attribution, and coverage controls. The table below summarizes the difference at the dashboard level. For what each tier costs and how to change plans, see your billing settings or contact Everflow.
Throughout this article we will point out where Basic and Premium see the same screen differently, since the dashboard adapts to your tier.
How Traffic Health Is Organized
Version 3 introduces a three-level structure that mirrors how problems actually nest. A domain belongs to your whole portfolio, an incident belongs to a single domain, and a reputation flag often traces down to a specific IP. Once these three levels click, the rest of the interface feels obvious. Here is the new Overview that ties them together.
The three levels: Global, Domain, and IP
Every part of Traffic Health belongs to one of three levels. Knowing which level you are on tells you how wide a view you are seeing. The diagram below shows how they nest, from your whole portfolio at the top down to a single IP.
1. Global level your whole portfolio
Home for the Overview, Uptime Incidents, Reputation Flags, Tasks, Usage, and Configurations tabs. Start here every day.
2. Domain level one domain
Everything happening on one selected domain: its uptime timeline, its tasks, its reputation, and its usage. You reach it by selecting a domain from the Your Domains list on the Overview.
3. IP level one IP
The individual IP addresses behind a domain, each with its own activity and reputation. This is the deepest level, and where a domain-wide reputation flag gets traced back to its source.
You move downward by drilling in (portfolio, then domain, then IP) and back up the same way, so you can zoom from "how is everything?" to "what exactly is wrong with this one IP?" without ever losing your place.
The Traffic Health tab bar
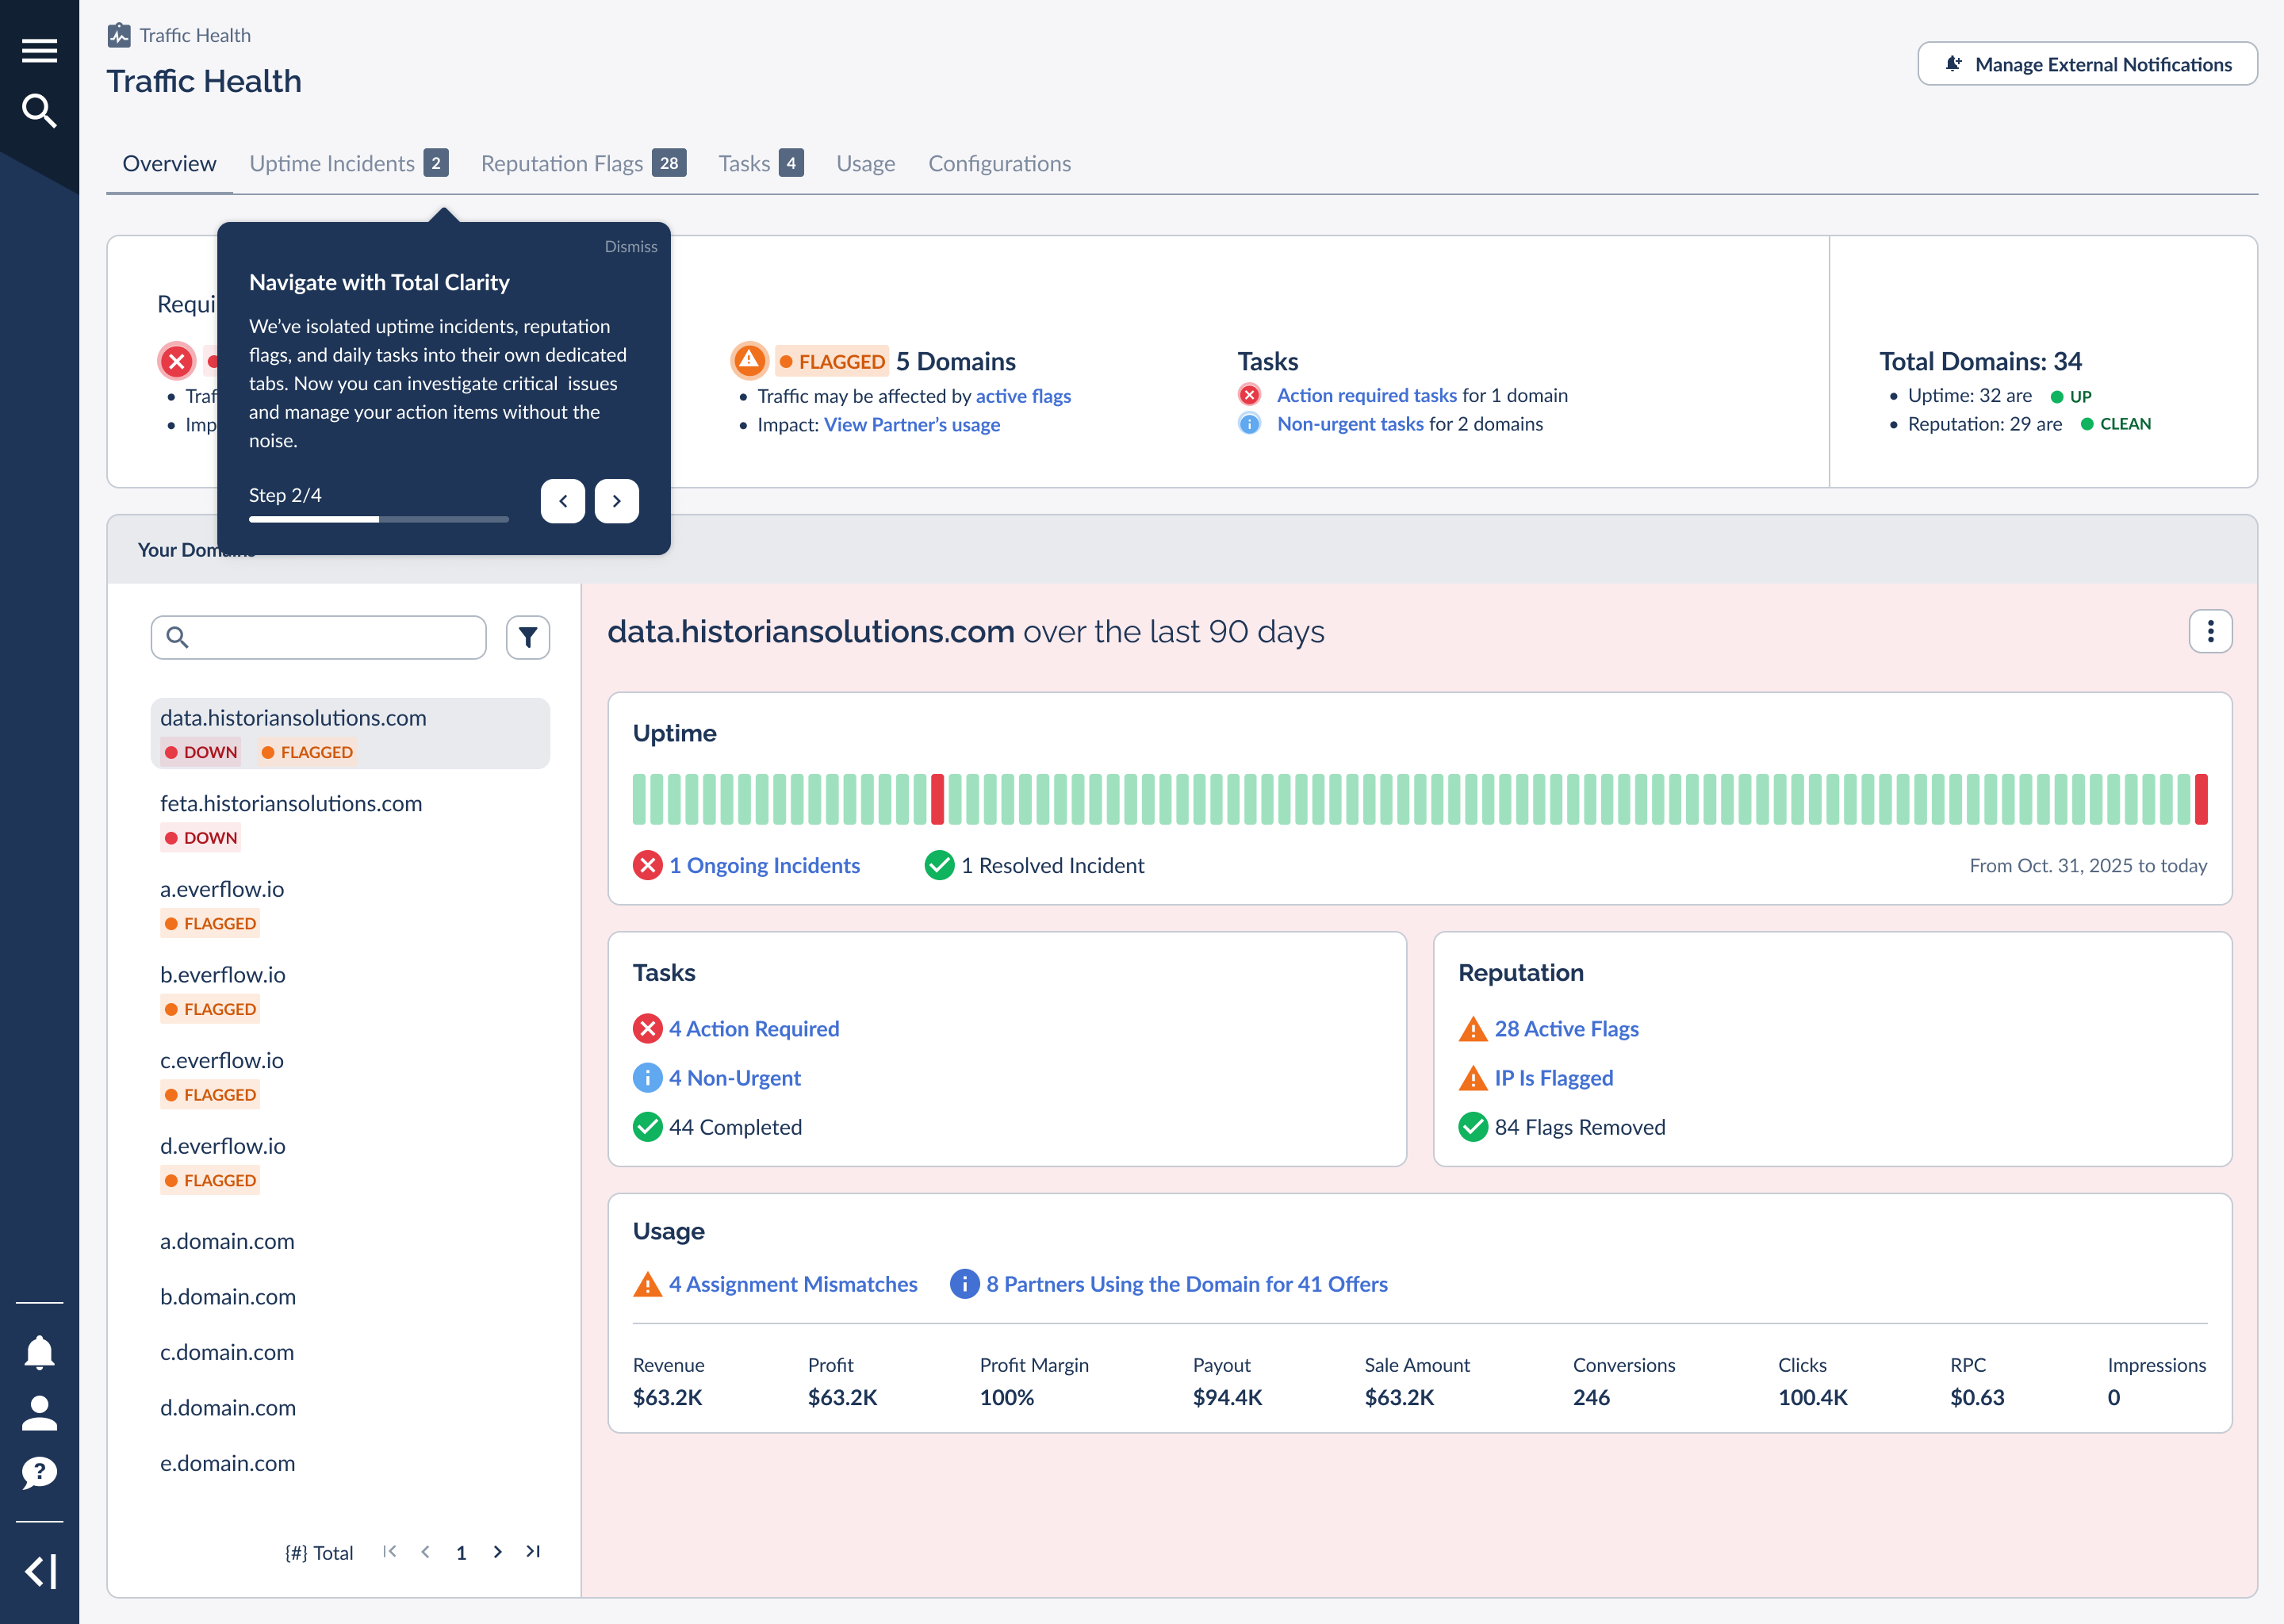
At the Global level, a single row of tabs replaces the old stacked, scrolling layout. Each area now has its own dedicated tab, and the nested sub-tabs from the previous version are gone. Content that used to hide inside a sub-tab now has a clear home. The tab bar appears across the top of every Global view.
The tabs, left to right, are Overview, Uptime Incidents, Reputation Flags, Tasks, Usage, and Configurations. Several carry a live count badge so you can triage at a glance, such as the number of ongoing incidents, active reputation flags, or open tasks.
The Uptime Incidents, Reputation Flags, Usage, and Configurations tabs each have their own detailed articles. This one focuses on the Overview and how everything connects. You will also find a
The Overview Tab
The Overview is deliberately lean. Rather than cram every detail onto one page, it answers two questions fast: what needs my attention right now, and how is my portfolio doing overall? It does this with three pieces stacked from top to bottom: a Requiring Attention band, a Total Domains rollup, and the Your Domains list with a detail panel.
The Requiring Attention band
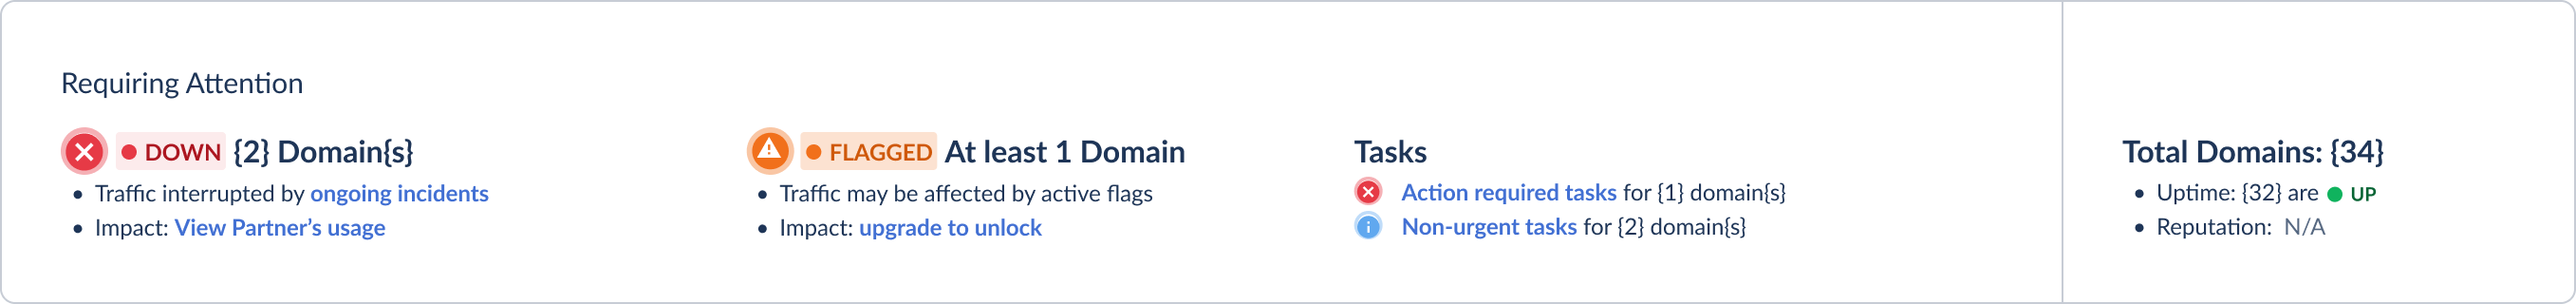
The Requiring Attention band is the first thing you see, and on a busy day it is the only thing you need. It groups the issues across your portfolio into clear rows so you can prioritize. When something is wrong, you will see rows like these:
DOWN MOST URGENT
Domains currently experiencing an ongoing incident. Traffic on these is interrupted, so start here.
FLAGGED PREMIUM
Domains with active reputation flags. Traffic may be affected even when the domain is technically up.
Tasks
Outstanding action items, split into action-required (needed to resolve an active incident) and non-urgent (recommended to prevent future problems).
Each row tells you how many domains are affected and links you straight to the impact, such as which partners are using an affected domain, so you can move from "something is wrong" to "here is who it touches" in a single click. The screenshot below shows the band with incidents, flags, and tasks all active.
When everything is healthy, the band collapses into a single reassuring all-clear message confirming that your domains are up and you have no open tasks. That green state is the goal, and it means there is nothing for you to do.

Total Domains rollup
Below the attention band, a Total Domains rollup gives you the big-picture numbers for the whole portfolio in one line: how many domains you are monitoring in total, how many are currently up, and, on Premium, how many are clean from a reputation standpoint. Think of it as the scoreboard that complements the issue-by-issue detail above it. On Basic, the reputation figure reads as not applicable, since reputation monitoring is a Premium capability.
Your Domains list and detail
The lower portion of the Overview is a two-pane layout. On the left is the Your Domains list: every domain you monitor, each with a status indicator. On the right is the detail panel for whichever domain you have selected. This is where the old "Latest Activity" feed went. Instead of one mixed stream, you now see a focused, per-domain breakdown.
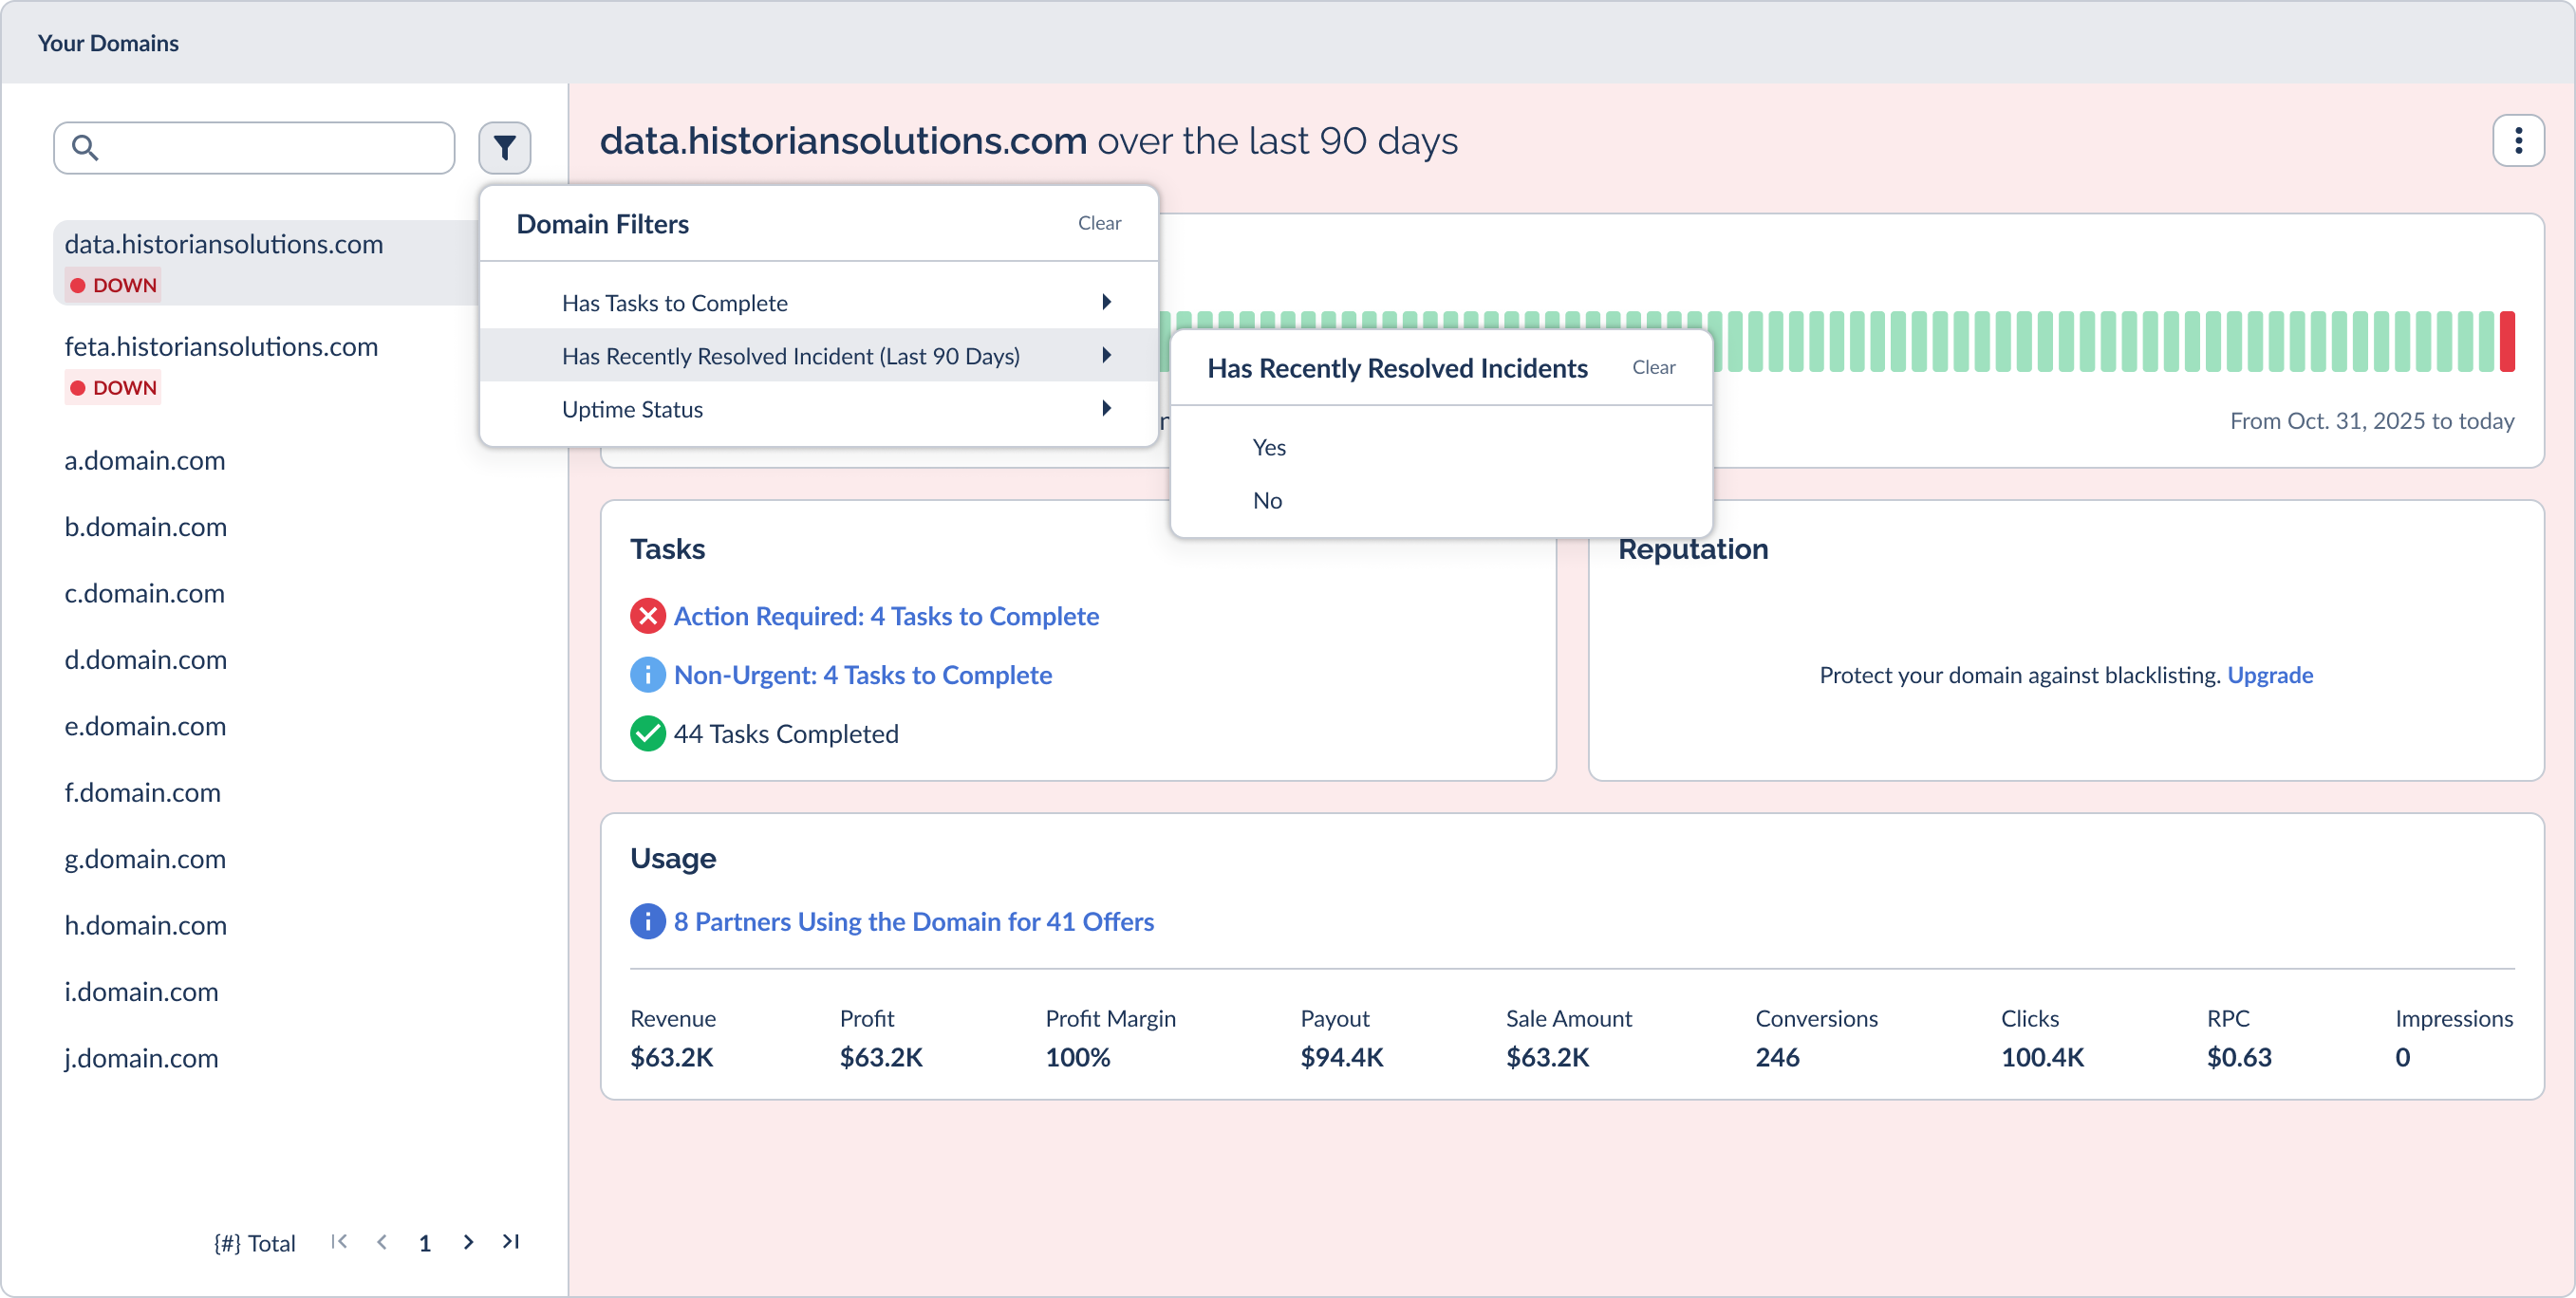
The domain list is searchable and filterable, so you can cut a long portfolio down to what matters. A filter flyout lets you narrow the list by criteria such as domains that have tasks to complete, domains with a recently resolved incident, or by uptime status.
Domains in the list carry status pills so problems jump out before you even click, such as a DOWN pill for an ongoing incident or a FLAGGED pill for an active reputation flag, and both together when a domain has more than one issue.
Drilling Into a Single Domain
Selecting a domain from the Your Domains list opens its Domain Details panel on the right, scoped to that domain over the last 90 days. This per-domain view is one of the biggest changes in v3: everything about a single domain is collected in one place rather than scattered across a shared activity feed. The panel stacks up to four cards, each summarizing one dimension of the domain's health.
Uptime
The domain's 90-day uptime timeline plus a count of ongoing and resolved incidents.
Tasks
The open and completed action items for this domain, split into action-required and non-urgent.
Reputation PREMIUM
Active and removed reputation flags for the domain. On Basic, this card is a prompt to upgrade.
Usage
How many partners and offers run on the domain, with revenue and performance metrics, plus any assignment mismatches to resolve.
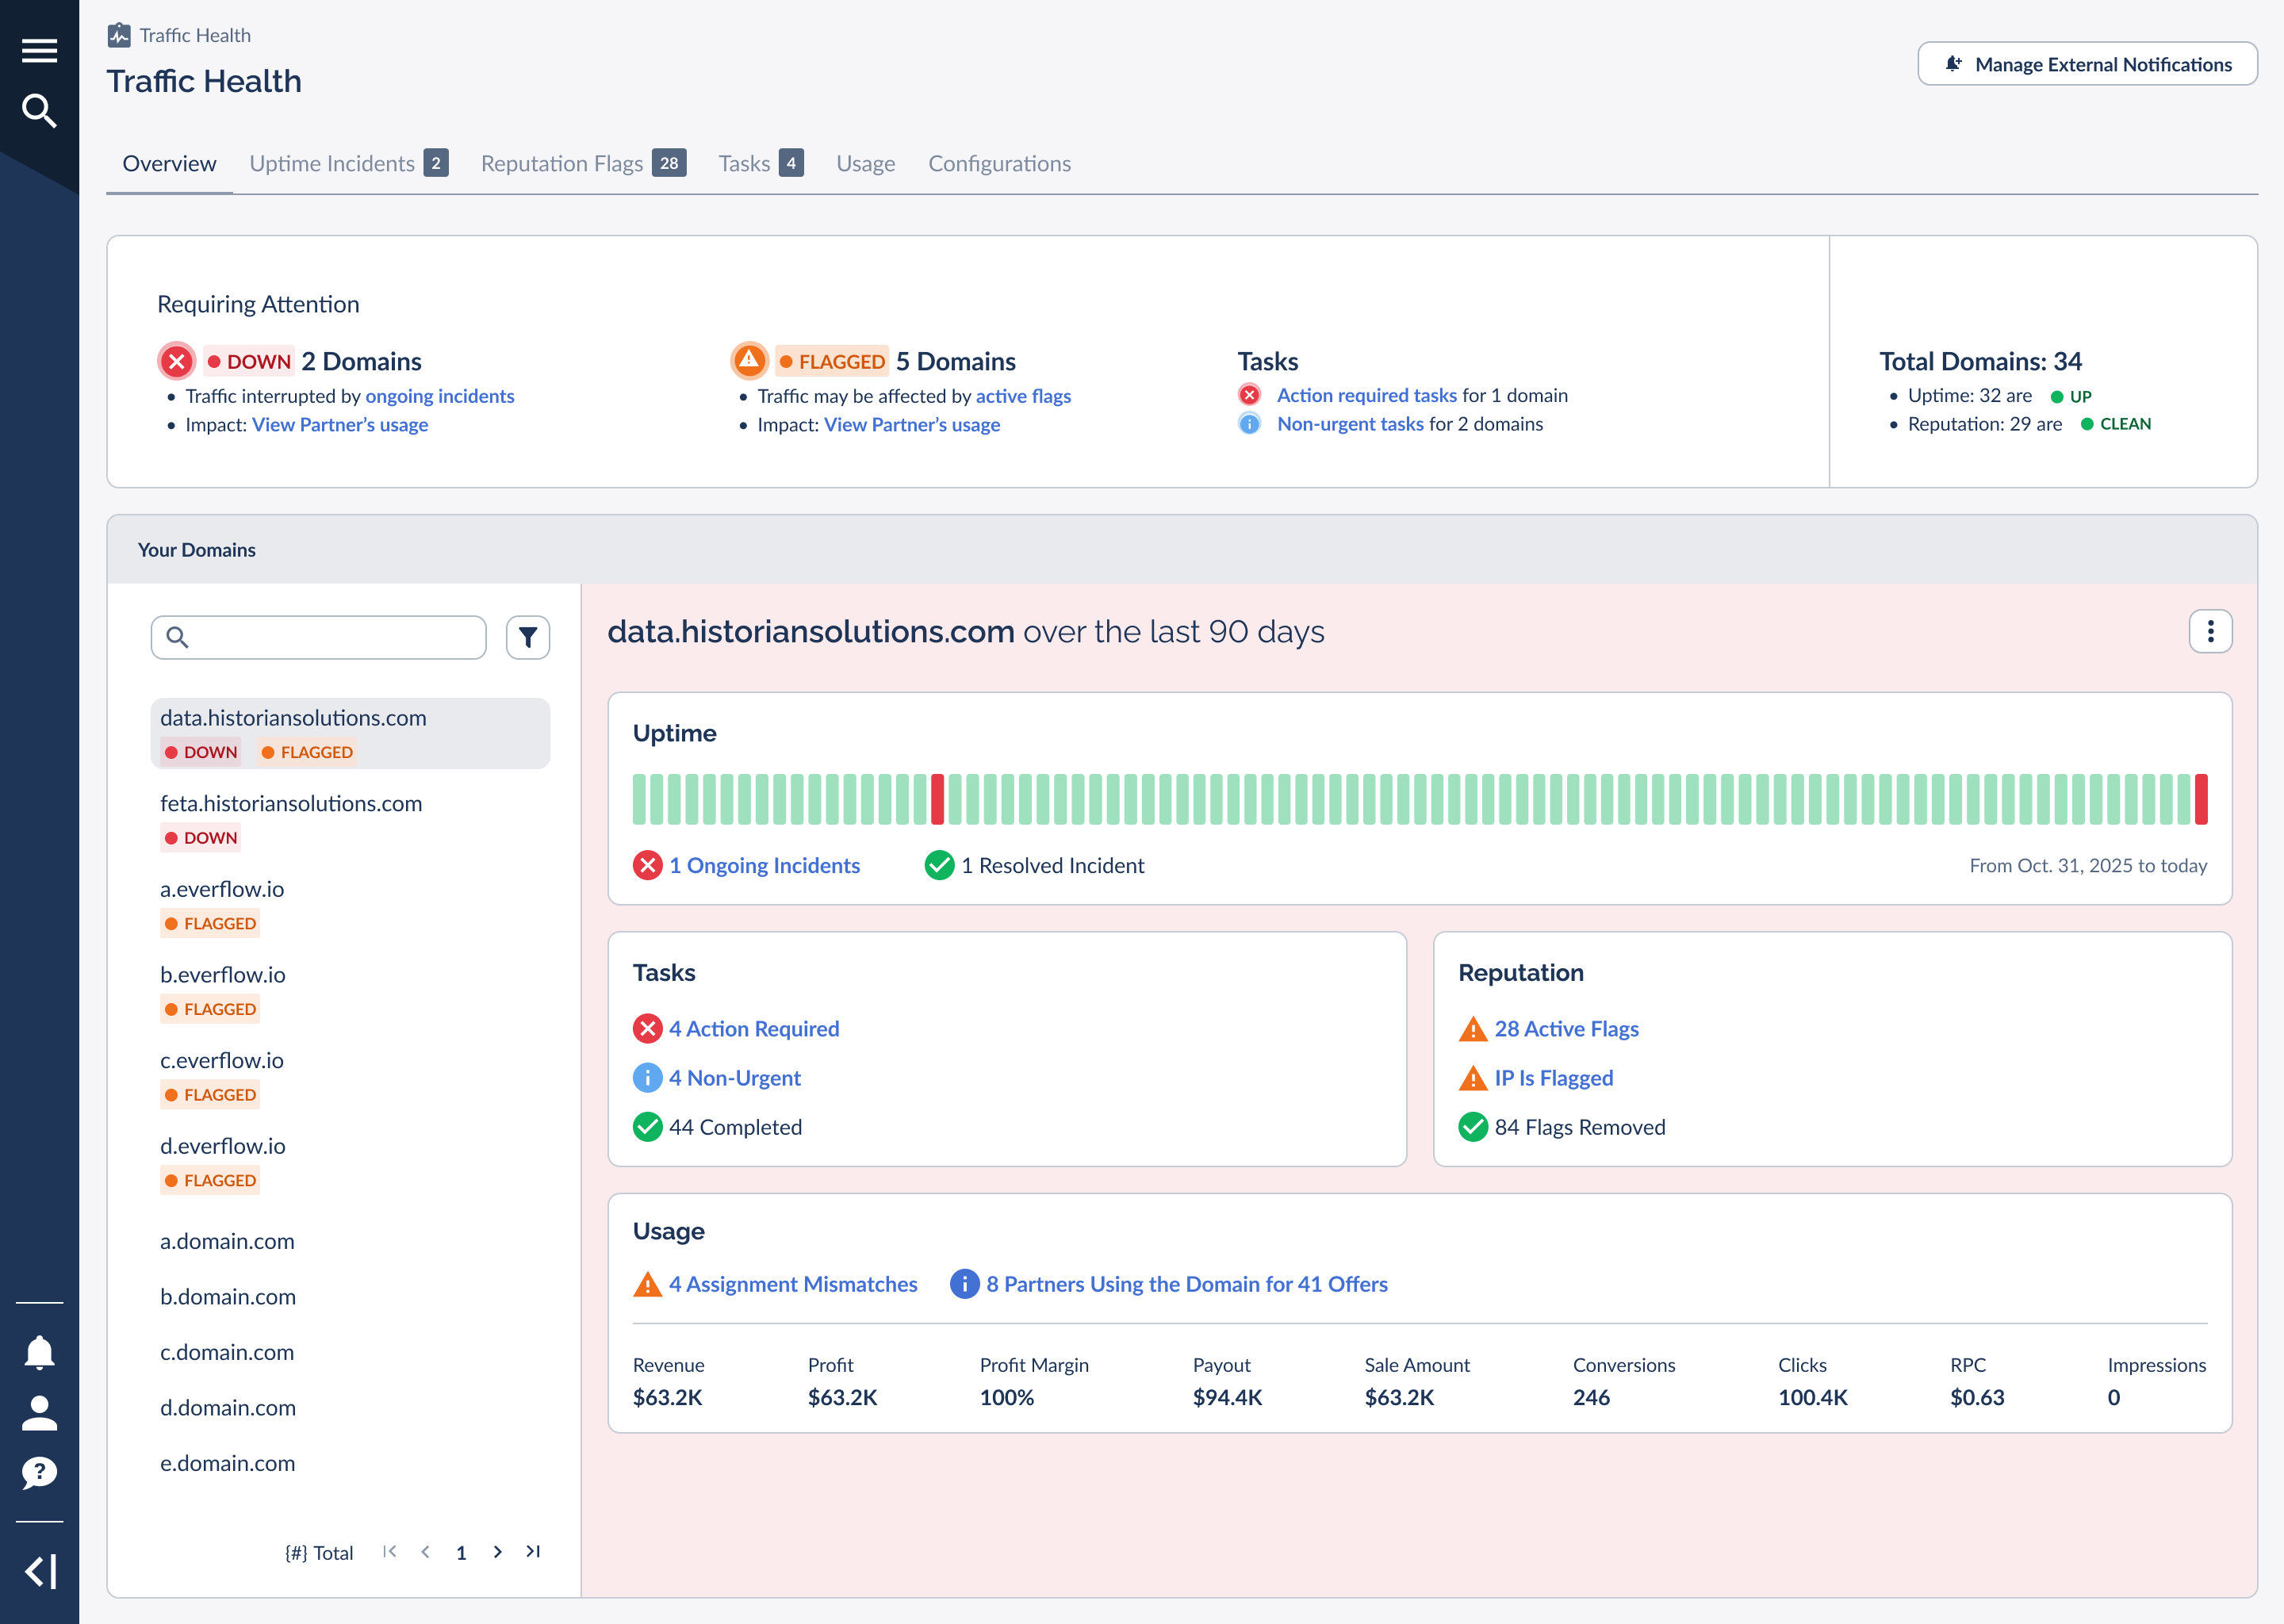
The screenshot below shows the Your Domains list on the left and a selected domain's detail panel, with its Uptime, Tasks, Reputation, and Usage cards, on the right.
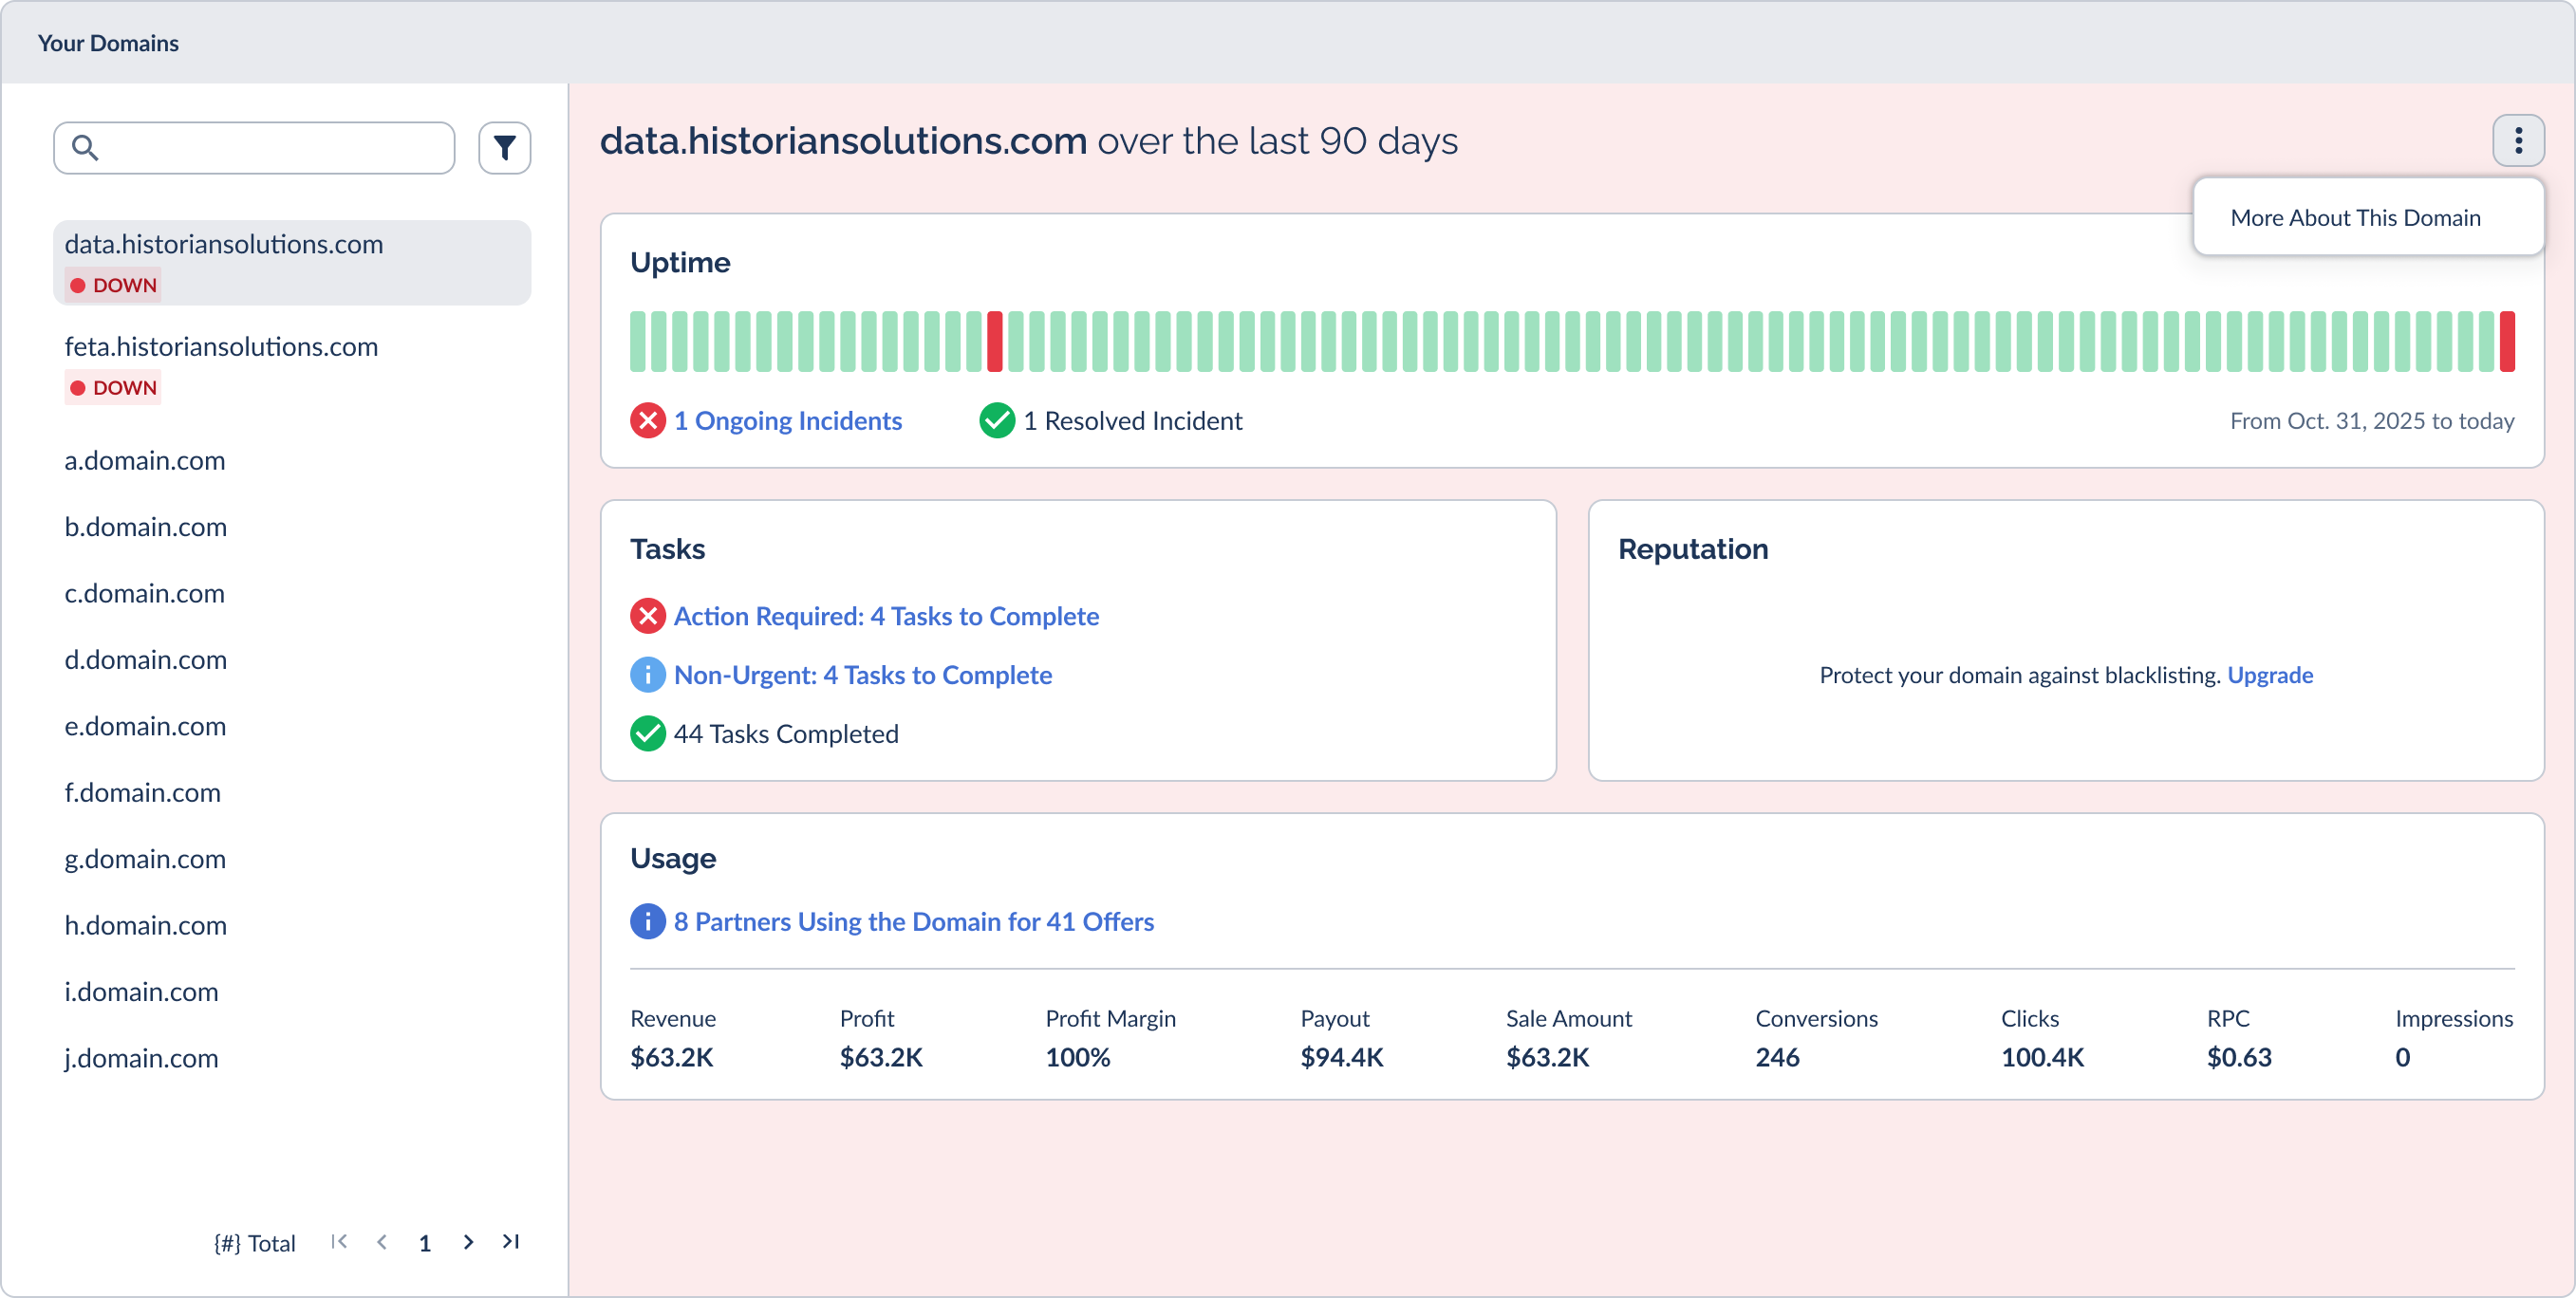
From a card you can jump straight to the matching Global tab. Open the Uptime Incidents tab to read an incident's full diagnosis, for example, or the Usage tab to see exactly which partners and offers a domain carries. The domain's own action menu (labeled "More About This Domain") gives you the rest of the per-domain actions.
The 90-Day Uptime Timeline
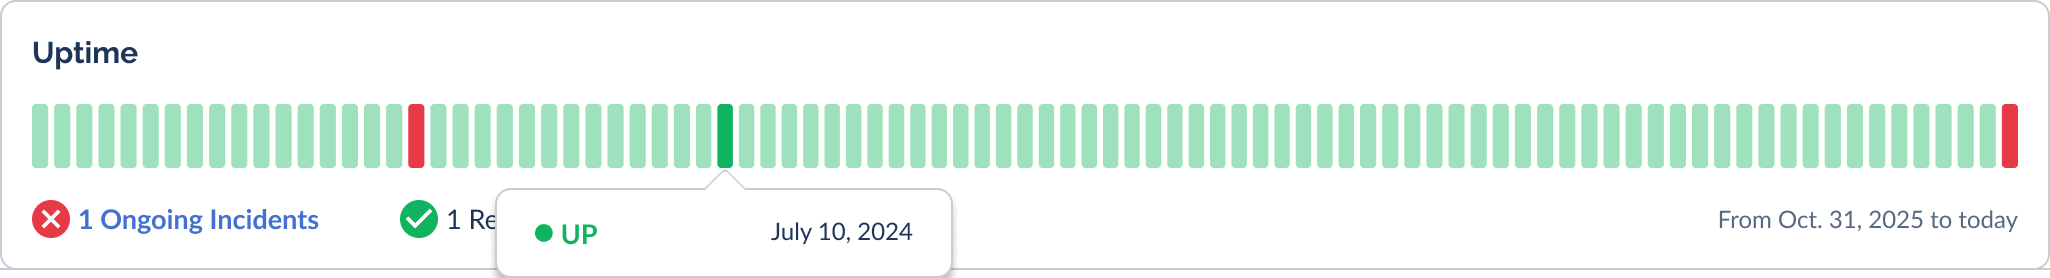
The Uptime card on every domain includes a 90-day timeline: a strip of daily bars showing whether the domain was up or down on each of the last 90 days. It is the fastest way to spot a pattern, like a domain that flickers repeatedly versus one that simply had a single bad day.
Hover over any day to see its status in a tooltip. An up day confirms the domain was healthy. A day with a resolved incident shows when the incident was detected, when it was resolved, and how long it took, with a link to the full incident. A day with an ongoing incident shows when it was detected and last observed, with a link to the live incident.
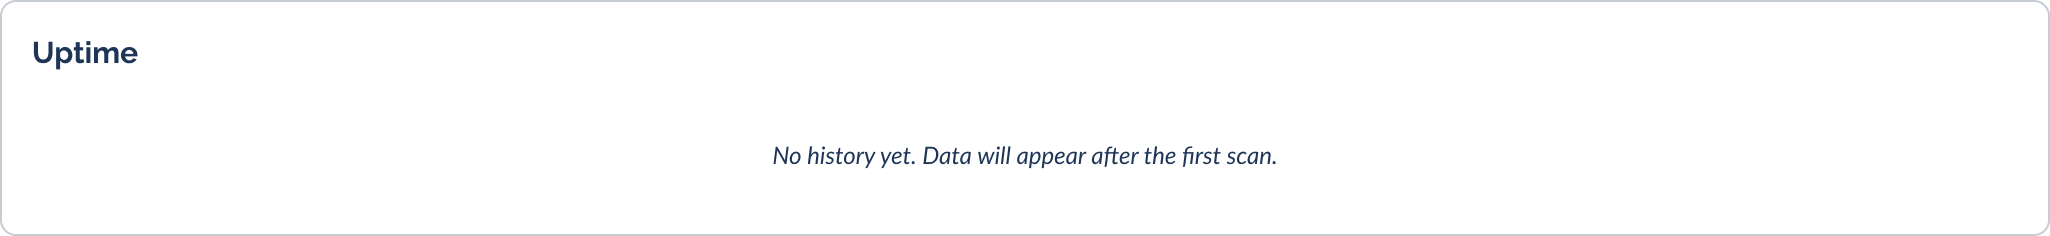
Newly added domains will not have 90 days of history yet. Until the first scan completes, the timeline shows a short "no history yet" message. After that it fills in from the date the domain was added, growing toward a full 90 days.
What Basic and Premium See on the Dashboard
The Overview is the same screen for everyone, but it adapts to your tier. Knowing the difference helps you read the dashboard correctly and understand what unlocking Premium would add.
On Premium, reputation is fully populated. The Requiring Attention band shows exact flag counts, the Total Domains rollup reports how many domains are clean, and flag rows link directly to the affected partners' usage so you can trace impact.

On Basic, uptime monitoring works exactly the same, but reputation is gated. The reputation figures read as not applicable, flag indications are approximate rather than exact, and the related links lead to an upgrade prompt instead of partner detail. The Reputation card in a domain's detail panel becomes an invitation to upgrade.
Reputation intelligence is powered by named reputation sources (Google Threat Intelligence, HetrixTools, and EasyList), and the partner-level attribution that pinpoints exactly which partner is behind a flag is a Premium capability. If you want that visibility, you can move to Premium from your billing settings or by contacting Everflow.
Make the Overview your daily five-second check. If the Requiring Attention band is green, you are done. If it is not, work the rows in order: start with the DOWN row, then FLAGGED, then Tasks. That sequence moves you from active traffic loss to prevention.
Frequently Asked Questions
Where to Go Next
The Overview is your launchpad. Once you have spotted what needs attention, the dedicated tabs and articles below take you deeper into each area.
→ Traffic Health Incidents & Reputation Management


