
Introduction
Say your track.brand.com lands on a blocklist overnight. The culprit usually isn't the domain itself. It's the IP address the domain is hosted on, and a single flagged IP can drag down every domain that shares it. The IP‑Level view in Traffic Health gives you one focused place to investigate a single IP: everything that has happened to it, every reputation flag against it, and exactly which of your domains it hosts.
The IP‑Level view is new in this release of Traffic Health. It's part of the simplified layout that splits monitoring detail into three focused levels (Global, Domain, and IP), so you can drill from the big picture all the way down to a single address without wading through nested tabs.
Before You Start
IP‑Level reputation data is double‑gated. To see reputation flags for an IP, you need both of the following:
Below the bullets, here's the quick way to think about it: reputation only unlocks when both gates are open at once.
Shared IP
Reputation tracked? No. The address is shared across networks, so its standing can't be attributed to you. Premium-eligible, but reputation stays locked.
Dedicated IP (MPS)
Reputation tracked? Yes, once you're on Premium. The address is yours alone, so its reputation is yours to monitor.
Premium ✔ + Dedicated IP (MPS) ✔ → reputation unlocked
You can tell which kind of IP you're looking at from its Hosting Type on the Configuration tab (covered below). When reputation data isn't available for an IP, the General activity and configuration details still apply. It's the Reputation Flags surface specifically that depends on the Premium-plus-Dedicated-IP combination.
Opening an IP's Detail View
You reach the IP‑Level view by drilling into a single IP from anywhere Traffic Health surfaces one, whether that's a domain's hosting details or a reputation alert. Once you're in, the breadcrumb at the top reads
The detail view is organized into three tabs. Everything about this one IP lives under them:
The rest of this guide walks through each tab in turn.
All Activity
The All Activity tab is a reverse‑chronological feed of everything that has happened to this IP: reputation status changes, individual flags being detected and removed, domains moving onto or away from the address, and the IP first being added to your plan. It's the fastest way to answer "what changed, and when?" without piecing the story together from separate screens.
You can narrow the feed to a date range using the date selector above it, and the feed paginates when there's a long history.
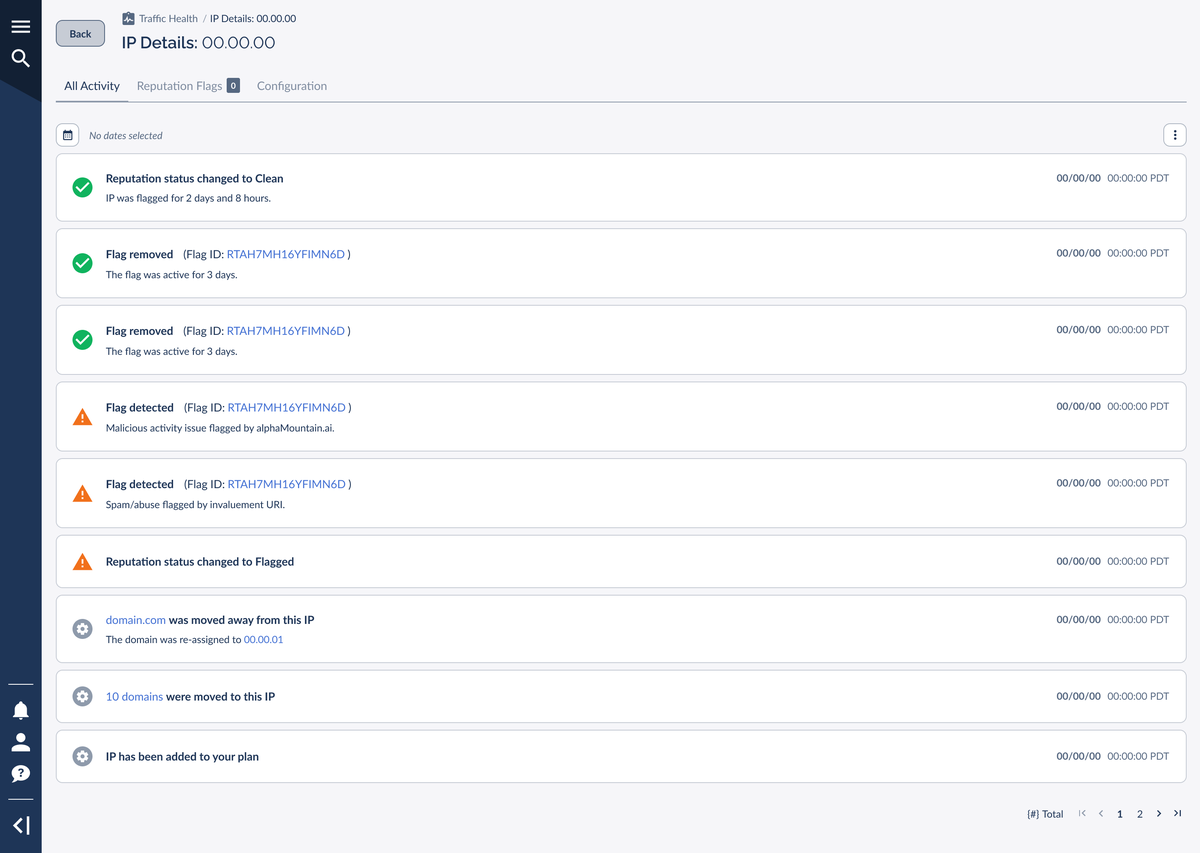
How to read an activity row
Every row in the feed follows the same shape, so you can scan it quickly. On the left is a status icon that tells you the nature of the event at a glance; in the middle is a bold title with an optional sub‑line of detail; and on the right is the date and time it happened.
Green check
Something resolved or returned to good standing: a flag was removed, or the IP's reputation went back to Clean.
Orange warning
Something needs attention: a reputation flag was detected, or the IP's status changed to Flagged.
Gray gear
A configuration or housekeeping change: domains moved on or off the IP, or the IP being added to your plan.
Here's a single flag‑detection row, for example, with its orange warning icon and a sub‑line naming the flag and what triggered it.

The event types you'll see
The feed records the following kinds of events for an IP:
Reputation Flags
The Reputation Flags tab is where you investigate an IP's standing in depth. This is the double‑gated surface described in Before You Start: it shows data only for a Dedicated IP (MPS) on a Premium plan. If your IP doesn't qualify, the tab points you to Traffic Health: Packages & Billing, where you can see how reputation monitoring is unlocked.
The reputation summary banner
At the top of the tab, a banner gives you the IP's reputation at a glance: its overall Reputation Status, a count of active flags broken out by category, and a rolling count of recently‑cleared flags. When the IP is in good standing the status reads CLEAN and every category count sits at zero.

When one or more flags are active, the status switches to FLAGGED and the category counters show you exactly where the problem is: how many Malicious Activity, Spam/Abuse, and Tracking/Advertising flags are currently open.

The banner also shows a Removed Flags figure: the number of flags that have cleared on this IP over the trailing 90 days. If six flags were raised and four have since cleared, Removed Flags shows four. That trailing window keeps recently-resolved flags from reading like an ongoing problem.
Removed Flags
A rolling count of reputation flags that were raised against this IP and have since cleared, over the trailing 90 days. It's the banner's "recently recovered" signal: six raised, four cleared → Removed Flags reads 4.
The flags table
Below the banner, a table lists each individual flag in detail so you can act on it. You can filter by detection date and by flag status (for example, only Active flags), and sort by Flag ID.
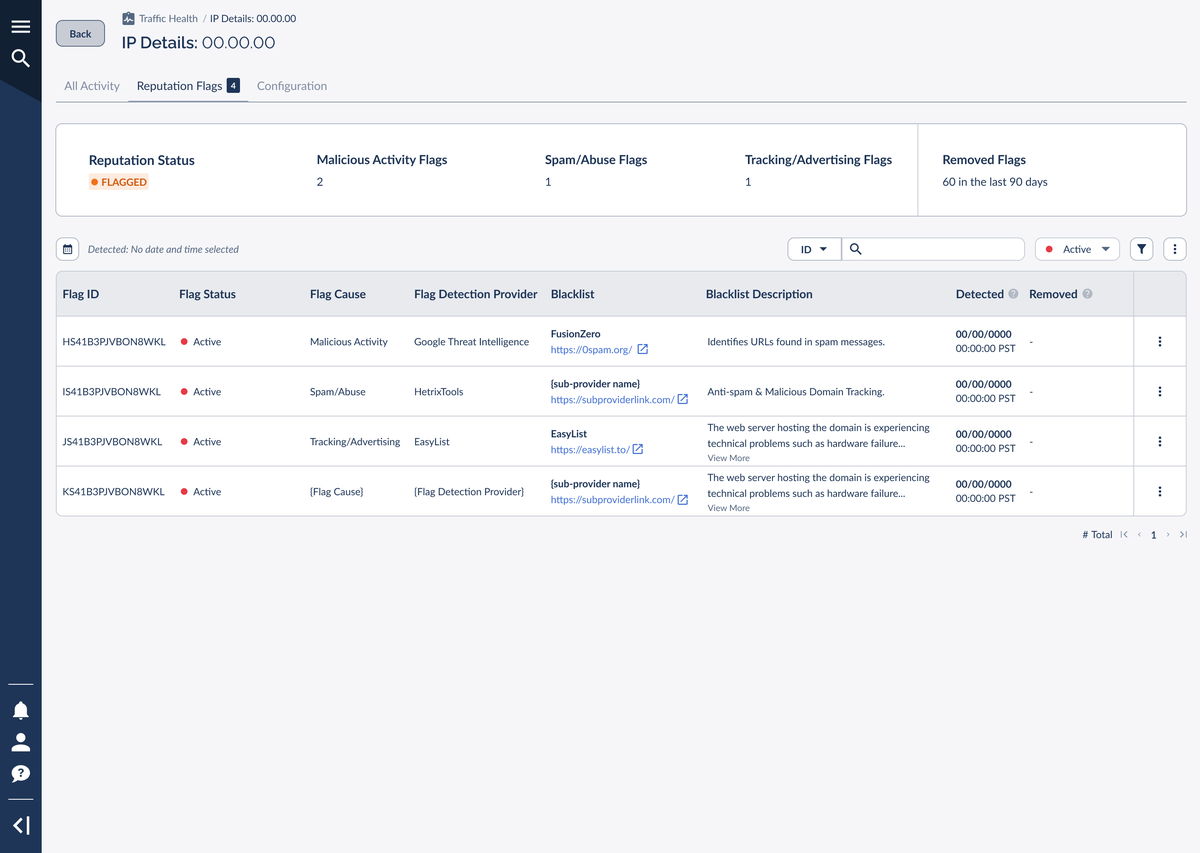
Each row carries everything you need to understand and trace a flag:
The flag taxonomy
Every reputation flag, whether it's in the banner counts, the activity feed, or the table's Flag Cause column, falls into one of three categories:
Malicious Activity
The IP is associated with harmful behavior, such as URLs tied to malware or other threats. These are the most serious flags.
Spam/Abuse
The IP appears on lists that track spam or abusive sending, which can hurt deliverability for domains hosted on it.
Tracking/Advertising
The IP appears on lists used by ad‑ or tracking‑blocking tools, which can affect how reliably your links and pixels load.
Configuration
The Configuration tab holds the IP's reference details, organized into two collapsible cards: General for the IP's own metadata, and Domains Hosted for the list of your domains that live on it.
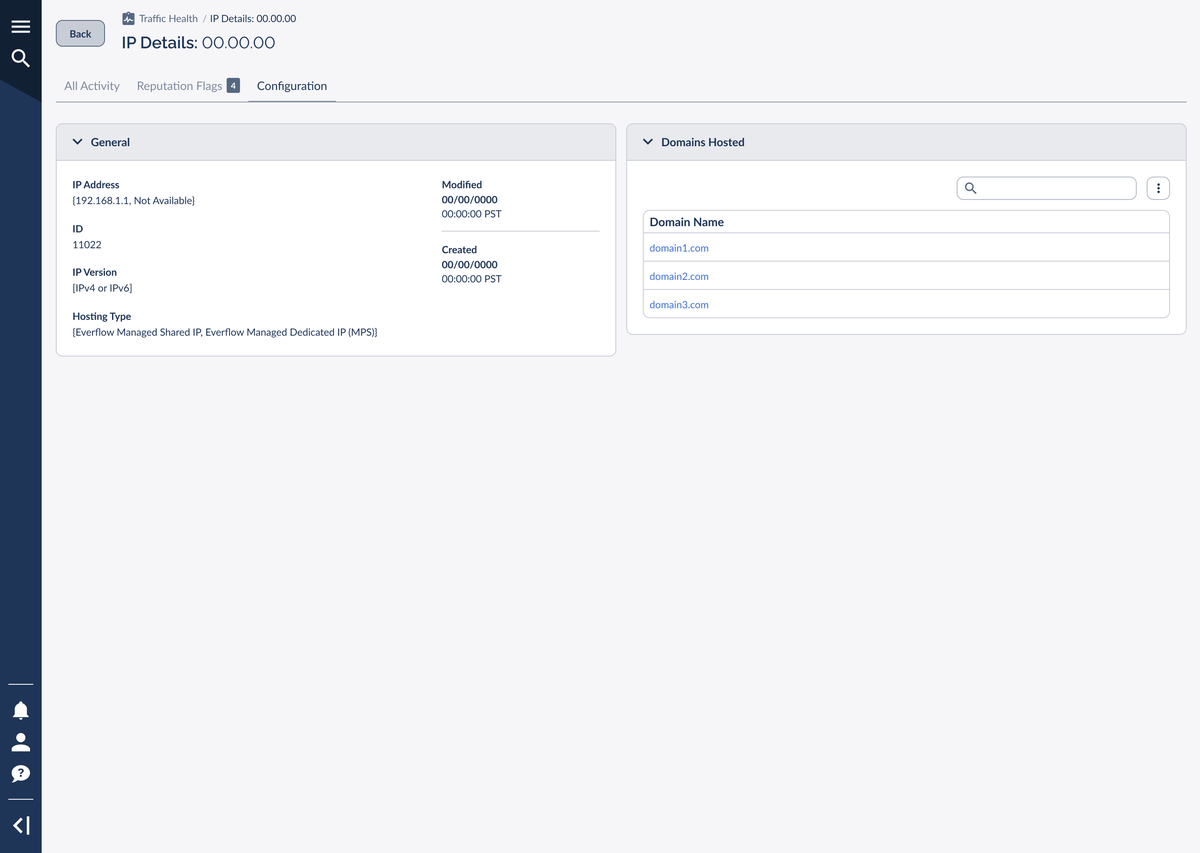
General
The General card describes the IP itself:
Domains Hosted
The Domains Hosted card lists every domain currently assigned to this IP, each one linked so you can jump straight to that domain's detail view. When an IP hosts many domains, use the search box at the top of the card to find one quickly. This is the relationship that makes the IP‑Level view so useful: if an IP is flagged, this list is exactly which of your domains are exposed.
Frequently Asked Questions
Reputation data is double‑gated: it requires Traffic Health Premium and a Dedicated IP (MPS). Check the Hosting Type on the Configuration tab. If it reads "Everflow Managed Shared IP," reputation isn't tracked for that address. The All Activity and Configuration tabs still work regardless.
A Shared IP hosts domains from more than one network, so its reputation isn't yours alone and can't be attributed to you. A Dedicated IP (MPS) is reserved for your network, which is why reputation can be monitored on it.
It's a rolling count of reputation flags that were raised against the IP and have since cleared, over the trailing 90 days. It gives recent context so a resolved issue doesn't read like an active one.
Drill into the IP from the domain's hosting details to open the IP‑Level view. The All Activity feed shows what changed and when, Reputation Flags shows whether the IP itself is flagged, and the Domains Hosted card on Configuration shows which of your other domains share the same address.


