
Overview
In Everflow, a Conversion (CV) represents a successfully completed action that was the goal of your Offer - like a purchase, app install, or subscription sign-up.
The Conversion Report helps you validate the quality of these actions by showing which Conversions were Approved, Invalid, Pending, or Rejected, along with detailed error messages explaining why certain Conversions weren't counted.
This helps you spot fraud patterns, track valid sales, and ensure you're only paying Partners for genuine Conversions.
But let's explore the main features and uses of this report!
Key Features
How to Access and Use the Conversion Report
Customizing Your Report
.gif)
Advanced Features
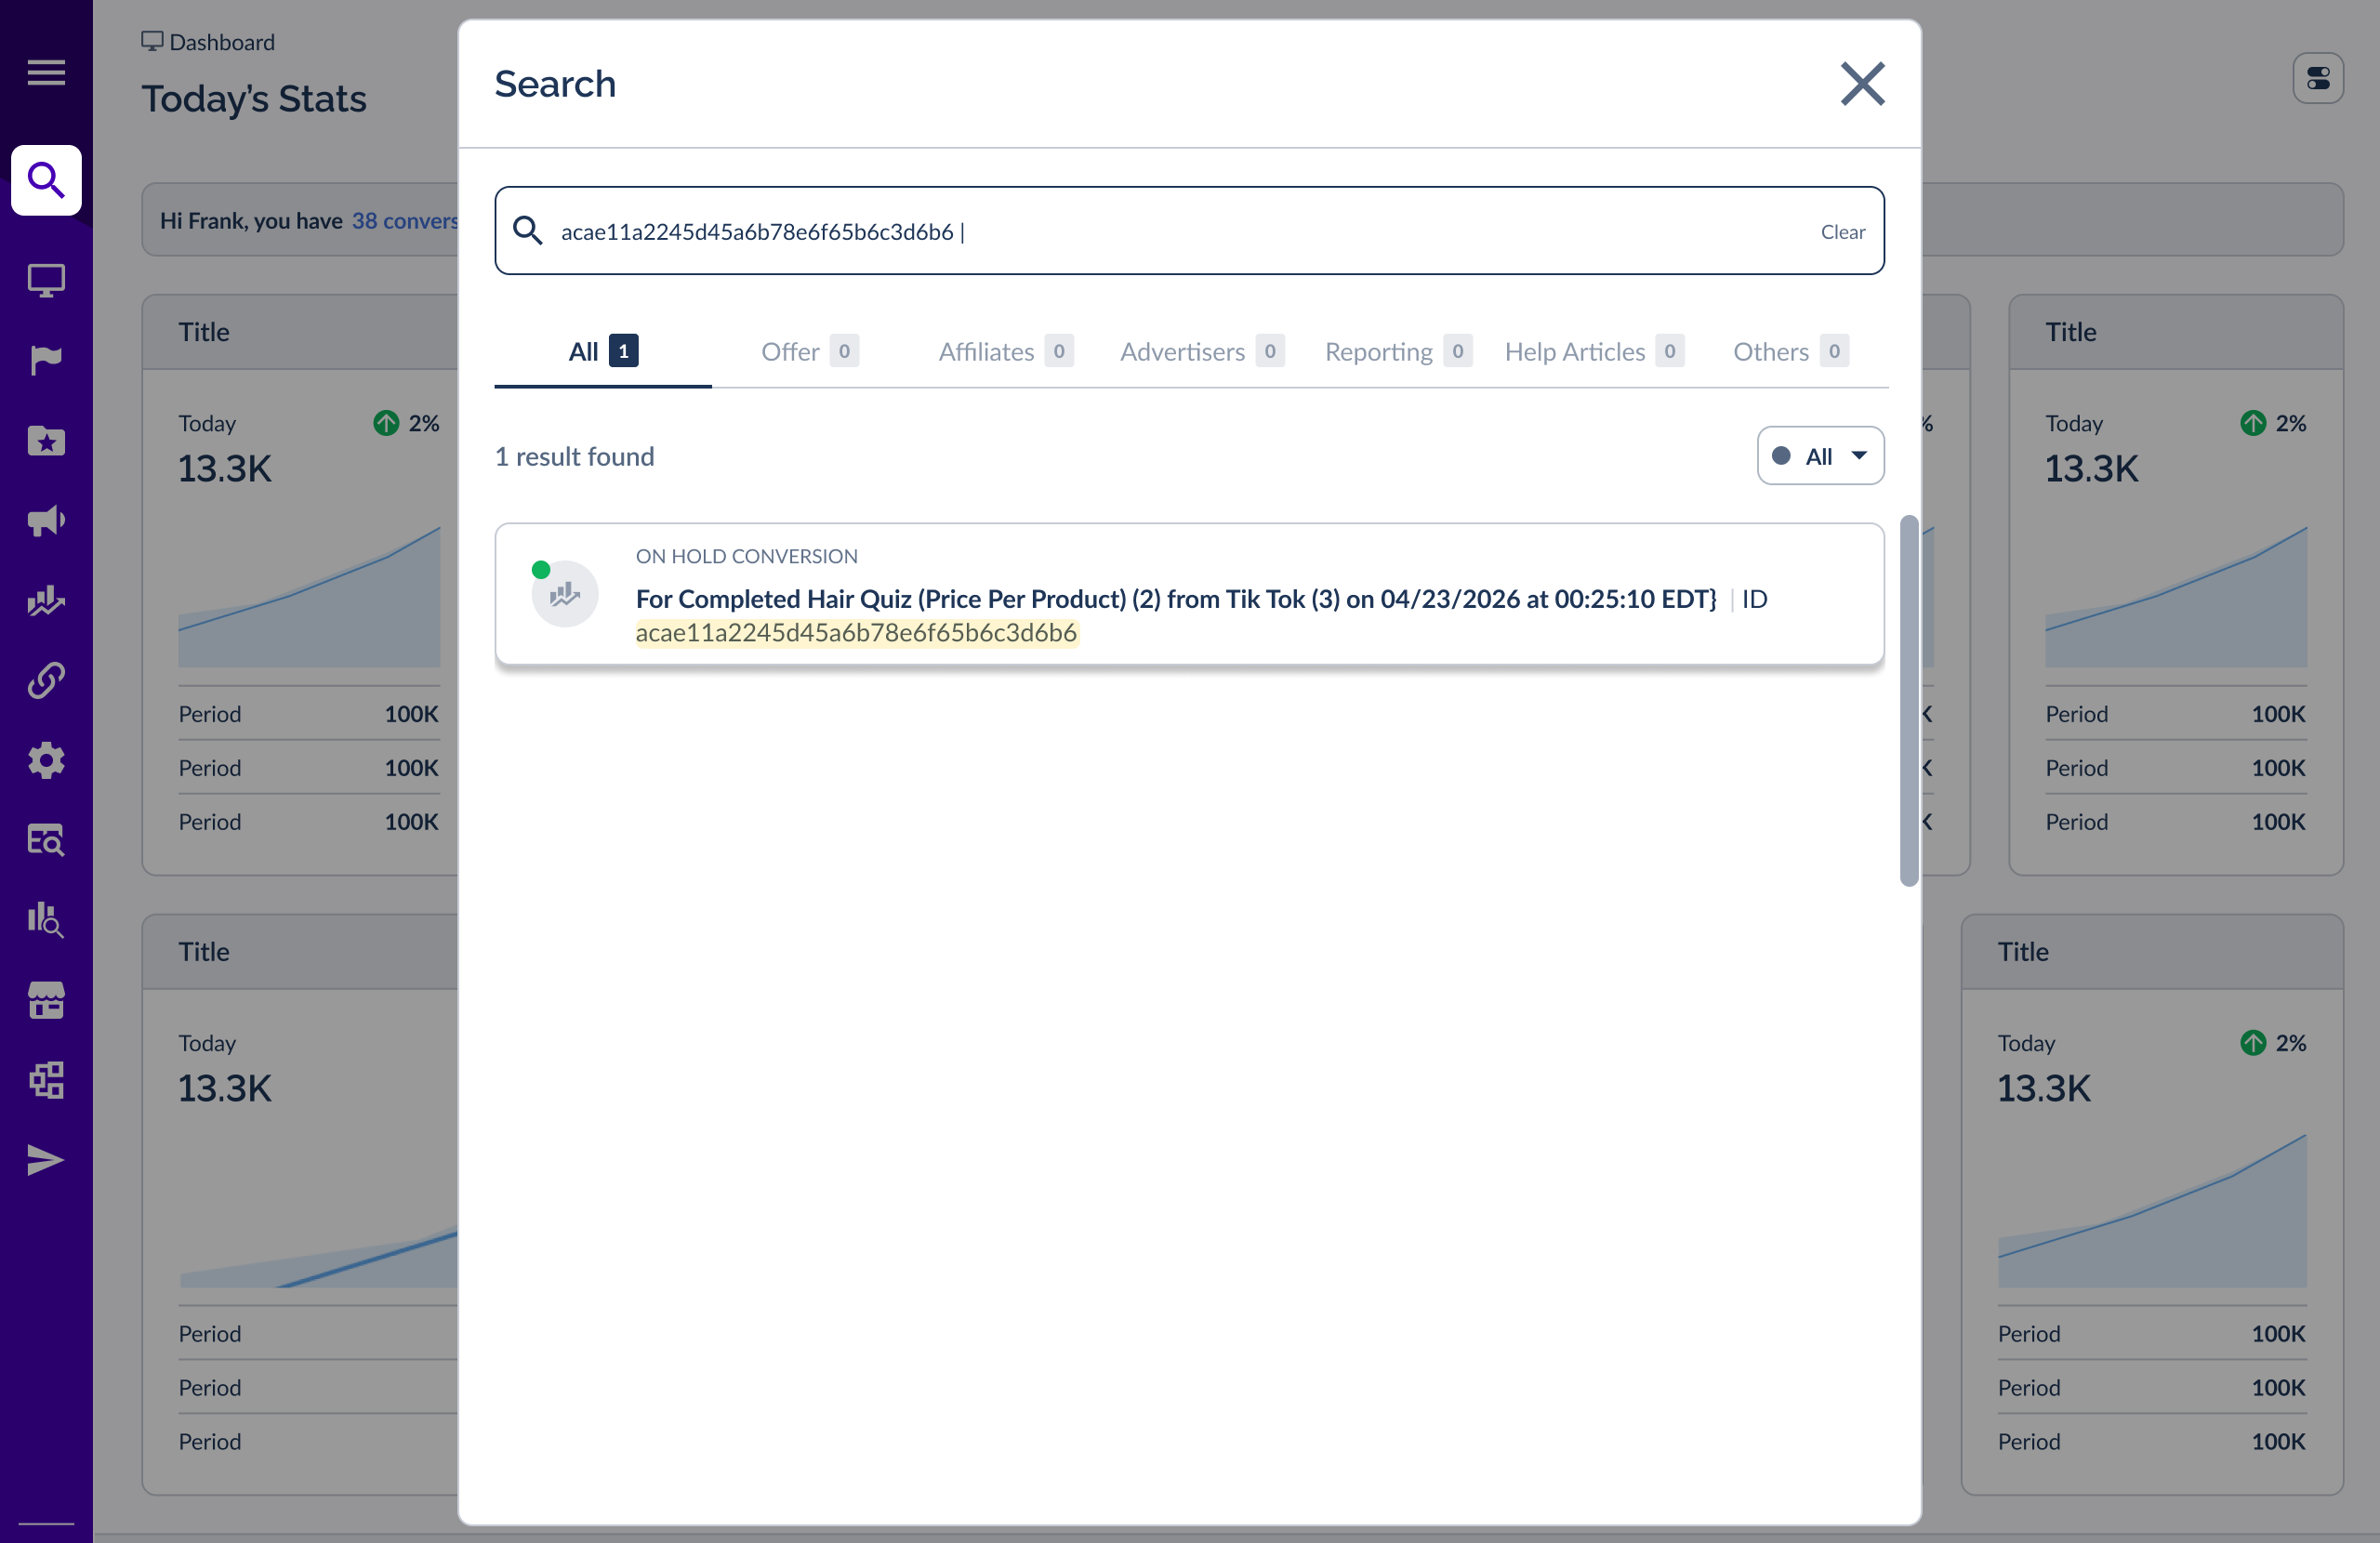
Finding a Specific On-Hold Conversion by ID
If you need to locate a single On-Hold Conversion, you can now search for it directly by its On-Hold Conversion ID from Everflow's global Search panel, instead of exporting all On-Hold Conversions to a CSV and searching through them manually.
Note: Searching by On-Hold Conversion ID uses the same access and permissions as the existing Conversion Search — if you can use Conversion Search, you can use this.
Aggregating Report Data
To get a broader view of your Conversion data:
.gif)
This feature allows you to easily analyze trends across different dimensions of your data.
For example, you could aggregate data by Offer and Partner to see which Partnerships are most effective, or by Sub IDs to evaluate the performance of specific traffic sources or campaigns.
A Real-Life Example
Let's say you run "BloomBox," selling plant subscriptions:
Best Practices
Stay on top of your non-approved Conversions by checking them regularly to catch and fix any problems early. The aggregated report feature helps you spot patterns in Conversion quality across your different Offers and Partners.
When you need to solve specific problems, the flowchart feature can help you figure out what's going wrong.
To make all this easier, customize your column view so you can quickly understand the details of each Conversion.
➔ Choosing a Conversion Method: Select the best tracking method for your business needs.
➔ Enable Click to Conversion Time: Set the time window when a click can be counted as a valid conversion.


